Irish Times Opinion Polls, 1975-2020

Eamon de Valera once said: “whenever I wanted to know what the Irish people wanted I had only to examine my own heart and it told me straight off what the Irish people wanted.” Nowadays he would have opinion polls at his disposal, although they also come with a margin for error.

Ireland was relatively late in having regular political polling.  The first in depth poll was by Gallup on behalf of the Labour Party in April 1969. It was subsequently published in Nusight magazine edited by Vincent Browne. Their editorial suggested that “Ireland must be one of the least polled countries in Europe”. However, it was another decade before they appearing regularly in newspapers – much later than United States (since 1930s) and United Kingdom (since 1940s).

The novelty they once had was evident when the Fine Gael – Labour Government commissioned the Market Research Bureau of Ireland (now Ipsos MRBI) to carry out a pre-election poll in 1977. Public and private polls were around but were not yet an established part of politics. Nor indeed did they have a track record. Jack Jones (founder of MRBI) recalled that when presenting Ministers and advisers with statistics (correctly) predicting a Fianna Fail landslide, many in the room did not appear to understand the findings. Conor Cruise O’Brien (who would lose his seat) dismissed them as they “did not tally with the messages he was getting on the doorsteps in Howth”. In his autobiography, Garret Fitzgerald claimed Taoiseach Liam Cosgrave was particularly dismissive of polls, preferring to be “guided on public opinion by individual letters he received from time to time, extracts of which he sometimes read to use in Government”.

After their success in predicting the 1977 vote, polling finally became regular feature. The two main series were Irish Marketing Surveys (now part of Kantar Milward Brown) for Irish Times and MRBI for the Irish Independent. The two companies then switched paper in 1982. Below are graphs from the Irish Times series (mainly because data was easier to find!). The sources are:

Support for FF FG Lab

Source for All Graphs: Irish Times – IMS / Ipsos MRBI

Historic Irish polling has four consistent parts: the 3 established parties – Fianna Fail, Fine Gael and Labour Party – and an “Other” remainder. The usual margin of error applies throughout and would explain much of the short-term volatility. As mentioned, polling from 1975 to June 1982 is IMS and from October 1982 to January 2020 is Ipsos MRBI. The first published Irish Times IMS poll was actually in August 1978. Fortunately articles on the poll included a time series of polling that was unpublished or commissioned by RTE. A note of caution with IMS is that before 1977 election some respondents responded “Coalition (Unspecified)”. So, it’s reasonable to assume that Fine Gael and Labour support is slightly deflated and “Other” inflated. An alternative would be the sacrifice three years and start in October 1977.

The former dominance of Fianna Fail is the graph’s most striking feature. Their support peaked at 64% in October 1977 – following an election win thanks to an infamous giveaway manifesto. For the next 30 years support fluctuated between 40-55%. An uptick occurred in 1998 after the Good Friday Agreement and during the Celtic Tiger. A notable sharp fall (and perhaps a harbinger of things to come) was 34% in November 1994. This was after the fall of government in addition to the ongoing fallout from the Beef Tribunal and Brendan Smyth case. Fallibility to FF’s once solid support was also evident in early 2000s. An accumulation of corruption findings at Tribunals and a weakening economy were partly to blame. Then the economic crisis of 2008 caused a spectacular collapse. FF support fell from 47% in May 2008, to 23% in May 2009, and to 15% in February 2011. The party has since recovered slightly in polls and election but have been knocked of their perch.

Fine Gael’s performance has been more mixed. Their peak was 42% in 1982/83. They did not return near that level until post-financial crisis, with high 30s in summer of 2009 and run up to the February 2011 election. The first time FG were ever ahead of FF was in November 2008. (They were level in October 1982). In terms of public opinion this was perhaps the first time ever. Or first time since 1920/30s if you count Cumann na nGaedheal.

Yet even with FF plummeting their support was not secure. For instance, it fell to mid-20s in summer 2010, prompting Richard Bruton’s failed heave against Enda Kenny. In government FG’s popularity has waned, although to a level not unique in their polling or electoral history. The lowest recorded was 16% in January 1994 and it was below 20% on several occasions in pre-crash 2000s.

Labour is even more mixed. There were several significant rises in support – most famous being “Spring Tide” of early 1990s and “Gilmore Gale” of 2010, as well as two (thankfully) unnamed increases in 1979 and early 2000s. Two 2010 polls – June (29%) and September (33%) – saw the party as the most supported. The first time for them and any third party. As with previous experiences in office, Labour’s popularity has suffered, although it appears recovery has been slower than usual. The public now have more choice.

Support for Non FF FG Lab

Accompanying the fall of FF has been the rise of other parties and independents. Challenges to FF/FG/Labour are not new. In the 1940s there was Clann na Poblachta and Clann na Talmhan. In February 1986 the Progressive Democrats polled 25% – the first since their founding and above FG. The Workers’ Party polled 6% several times in late 1980s and threatened to make breakthroughs in urban areas. The emergence of Sinn Fein in the 2000s pushed “Others” up to 30%. But everything has changed since the financial crisis.

SF’s are now a major party. For nearly a decade they have polled in-and-around 20%, although they have under-performed in elections (with exception of Europeans 2014). In October 2014 they were narrowly the largest party – something they have achieved in other polls several times.

The Green Party’s support has not always been sustainable. The 3 “Green Waves” were: after the 1994 European elections, before the 2007 General Election, and post-European/Locals in 2019. The recent upswing is very much a reversal in fortune. In a few 2014/15 polls they were in fact below Ipsos MRBI’s 1% threshold and lumped in the “Other/Independent” category.

Support for FF FG Lab PD GP SF

Decadal Avg Party Support

The major “Other” parties – say those who won over 10% in an election – could be added.  Throwing more in does make the graph look [even more] unreadable. But perhaps it’s just an accurate illustration of modern Irish politics. It does show fragmentation since the economic crisis. This may well have happened anyway given trends in other countries. Perhaps it just accelerated the process. Table of decadal averages again highlights the main trends: FF down, FG/Labour up-and-down, PDs gone, SF up, and Green Party down but up again at time of writing.

Support for FF FG Only

Support for FF FG Lab Only

In the days of Haughey versus Fitzgerald, FF and FG held nearly 90% of the public. In recent years it has fallen below 50%. The second graph shows the combined FF, FG and Labour vote. (Here the problematic “Coalition” option of the 1970s is added). Previosuly Labour had been the primary cause of FF plus FG dips. But no longer. Now even the three legacy parties have fallen below 50% at times.

Irish Government Satisfaction2

Irish Taoiseach Satisfaction2

The other headline questions are on party leader and government satisfaction. There is obviously a correlation between the two. Although typically approval for Taoiseach is above both government and party support. The highest support for government (73%) and Taoiseach (84%) were both in April 1998 (just after the Good Friday Agreement). At the height of the Celtic Tiger and Peace Process in Northern Ireland, approval ratings were regularly above 50%. The lowest for government (4%) and Taoiseach (8%) were both in February 2011. Since the crisis approval has clearly fallen. The last time most Irish people were satisfied in their government was May 2007 – nearly 13 years ago.

Posted in Uncategorized | Leave a comment

Immigrant Population in the Republic of Ireland

Foreign Born % Population 1841-2016

Source: Census of Ireland 1841-2016. 

Note: Tourists and visitors were included from 1841-1936 and 1971. British military included 1841-1911. Rest are “Usually Resident” or “De Jure” Population. 

Ireland was long a place many wanted to leave. Only recently has it been a place many wanted to come to.

The immigration that accompanied the Celtic Tiger was the largest since the 17th century. While there were immigrations in-between – of Huguenots, Palatines, Lithuanian Jews, and others – they numbered in the hundreds or few thousands. Today’s immigrant populations are in the tens or hundreds of thousands.

“Foreign-Born Population” is the most commonly used measure of immigration’s scale. As the name suggests only place-of-birth is counted. Ethnicity, nationality, length of residency, and so forth, are separate measures and do not count.

Irish birthplace statistics are available since Census 1841. As they were tabulated by county before independence, it’s possible to calculate on a 26-county basis. (For consistency and simplicity only Republic of Ireland is included in this post). One problem with the time series is that until recently only a handful of countries were included in Census reports. As such, it’s only possible to include three places and an “Other Countries” remainder in the chart.

Its most notable feature is clearly the remarkable increase from the 1990s. In Census 2016 there were 810,400 people (17.3% of the population) who were born abroad and usually resident in Ireland. The share has more than doubled in last 20 years and risen five-fold in last 50 years. This is all the more striking given the native-born population (the main part of the denominator) has grown strongly as well.

First, however, it’s worth noting some possible limitations. As illustrated, a few percent of Ireland’s population has always been born abroad. Indeed from 1981-1991 the rate was 6%, which was actually around the West European average. That’s despite the fact that the 26-counties was considered to be a relatively ‘homogeneous’ until the 1990s, having missed out on both Europe’s post-war economic and migration booms.

There are a few reason why it may overstate what many would consider to be “immigration”:

  1. Those born in Northern Ireland are counted as foreign-born. In the past 160 years, 6-county born have made up about 1% of 26-counties’ population. In Census 2016 there were 57,300 (1.2% population). There’s a good argument to subtract them, making the Republic of Ireland’s “Foreign-born Population (excluding Northern Ireland)” 16.1% in 2016.
  2. Returning members of Irish diaspora are counted as well. The Republic has one of the highest “Native-Born Populations Living Abroad” rates in the OECD. In the past it was even greater. The bulk of emigrants went to English-speaking countries (UK, North America, and Oceania) and until Census 2006 that’s where most foreign-born originated. While it’s difficult to be precise as there’s no statistics on parents’ place-of-birth, many were and are the children or grandchildren of Irish emigrants. It was particularly obvious during 1970s – the first period of positive net migration for centuries. Between Censuses 1971-81 the 0-19 year old UK-born population increased by 50,000 and USA-born by 5,000. Nearly one-in-ten of that age-group was foreign-born in 1981. Another imperfect measure (see further below) is ethnicity: 28% of foreign-born people said they were “White Irish” in 2016.
  3. Ireland’s close links with Britain arguably means migration across the Irish Sea should be considered regional rather than international. There have been freedom of movement agreements between the two countries since 1923. Unsurprisingly, Great Britain has historically been the main non-Irish place-of-birth. It has fluctuated over time. From 1911-26 there was a sizeable fall, mainly because of withdrawal of British administration and army. But from 1961-81 and in the 1990/2000s there were notable increases, thanks mainly to economic growth, which made Ireland a more attractive place for emigrants to return and British people to come. Although its share of total foreign-born has fallen, Great Britain remains the single largest birthplace.

A crude calculation could subtract those born in Northern Ireland (1.2% population in 2016), Great Britain (4.7%), North America (0.8%) and Oceania (0.2%) from total foreign-born (17.3%) leading to an alternative share of 10.4%. This of course quickly runs into trouble – why include some groups and not others? But it could perhaps be said that around 4-in-10 of Republic of Ireland’s foreign-born population are the old sort of “immigrants”. Many of whom would be in Ireland regardless of economic booms or migration policies. And it’s certainly worth pointing out that Ireland had an existing foreign-born stock before the Celtic Tiger. It didn’t suddenly jump from zero to 17.3%.

Foreign Born UN 1990 2010

Source: United Nations International Migration Stock Database (2017 edition)

It may be surprising that in 1990 the share was at the West European average. (Luxembourg is excluded as its rate is nearly 50%).  The share is now has one of the highest immigrant rates in the EU and OECD, although because of the financial crash (which impacted Ireland more) and migration crisis (which so far has impacted less), several European appear to have jumped ahead in rank. Of course all points above about border changes, immigration from diaspora, and from neighbours apply to many countries. For instance, the main foreign birthplace in Austria is Germany. Nordic countries all have populations born in each other’s countries.

Foreign Born Most Common Countries 1926-2016

The table above shows that Ireland has always been home to people from abroad. (The years chosen are simply those that were available). A couple thousand continental Europeans have appeared in every post-independence Census. The British Empire is also evident and not only the majority settled colonies. Tens of thousands of Irish emigrated to British India (now Bangladesh, India, Myanmar, Pakistan and some Gulf States) and South Africa. So some of the nearly 2,000 Indian born in 1926 would be children of Irish parent(s). For comparison, the Census for England & Wales in 1931 counted 86,000 who were born in British India, but an estimate in the Indian Census of that year estimated only 7,200 of them were of South Asian descent. This still means that there were people of other and mixed heritages in both UK and Ireland for many decades and centuries.

Russia was perhaps a surprising inclusion in 1926. As with all explanations here it wouldn’t include everyone, but many were the Jewish immigrants at turn of 20th century, from what are now Baltic States, then part of the Russian Empire.

Census 1961, which unfortunately was the last for a while to provide detailed birthplaces, listed 5,429 born in Continental Europe, 1,628 in Africa, 2,124 from Asia (also 57 from Japan) and 612 from Central/South America. While it’s important to note past diversity, it doesn’t change the fact that Ireland has been partially transformed in recent years. Census 2016 listed 320,530 from Europe, 51,215 from Africa, 93,939 from Asia and 22,712 from the Americas.

Foreign Born % Population 1961-2016 EU-ROW

The chart above is the same as first chart, but with “Other Countries” split between “Rest of EU” and “Rest of World”. Past Censuses only included a select group of European countries until 2000s, typically the EEC/EU member states at the time. Long-term time-series for EU15 and EU28 are unfortunately unavailable. Approximation should be reasonable given European-born population was relatively small until the 1990s and numbers from most countries left out (especially former Eastern Bloc states) would have been very small.

When Ireland joined the EEC in 1973 it was suggested the Irish migration might shift from Britain and its former colonies to the Continent. This has yet to happen significantly with emigration, which remains stuck to the old destinations. But did eventually happen with immigration, though not with original member states.

The “EEC9 (excluding Ireland & UK)”-born population did rise post-accession in 1973, from 4,950 in Census 1971 to 9,500 in 1981. But then fell slightly in 1986. These modest numbers are unsurprising as Ireland was the poorest member at the time. It was less modest in the 1990s. The rest of EU15-born population rose from 13,000 in 1991, to 32,000 in 2002 and 63,300 in 2016. (For previous comparison, the EEC9 population was 24,100 in 2002 and 43,200 in 2016).

Foreign Regions of Birth 1996-2016

New EU members accounted for most of the EU influx. 40% of foreign-born increase of the past 25 years was from EU15-28 countries. The accession of 11 countries in 2004 coincided with Irish property bubble’s height. In addition to demand for labour, only Ireland, Sweden and the UK had no initial restrictions on freedom of movement. Their population rose from 16,390 in 2002 to 293,797 in 2016. Nearly all came from former communist countries in Eastern Europe. Poland and the Baltic countries being the main sources. As Census 2006 was carried out in April, it missed out on most of 2006 and 2007 when immigration was peaking. It’s likely that the Eastern European population pre- 2008 was even greater than reported in following Censuses. The immigration surge was followed by sharp emigration. More EU15-28 nationals emigrated than Irish nationals until 2011. Between Census 2011-16 there were small falls for several countries, but the group’s overall population rose, thanks to newer new member states, Bulgaria, Croatia and Romania.

Main Countries of Birth 1996-2016

EU countries have accounted for about two-thirds of foreign-born increase since 1996 (this falls to half if the UK leaves). The Rest of World was mainly made up of countries that had small or non-existent communities before. While more traditional sources in North America and Oceania doubled in population, the bulk of increases were elsewhere.

Non-EU migrants usually come to Ireland after gaining residency permits for education, family or work reasons. The prospect of a well-paid job (by global and regional standards) would be the single biggest reason people are attracted to Ireland. Most foreign nationals are in employment and they have a higher labour force participation rate than Irish nationals. Foreign students in university and English language schools have grown as well, although many would have returned out of choice or because residency permit expired. A smaller number are asylum seekers. From 1989-2018 there have been 95,000 individual asylum applications. Not all would appear in the Census as some would have left the country or passed away.

The main countries of birth are perhaps those you would expect – i.e. places with large populations and poorer than OECD average. The composition of Ireland’s immigrant population is somewhat similar to the United Kingdom’s. (Note: UK’s population is 13 times that of the Republic’s). Broadly speaking the UK as relatively more Commonwealth immigrants and Ireland has more Eastern Europeans.

Foreign Born % of Foreign Born 1926-2016

The table above shows how foreign-born population has changed by broad region. A few entries are empty and Censuses skipped because data was unavailable. The “Other Countries” here is a residual rather than consistent category. As it shows until the 2000s the bulk of “immigrants” in Ireland were from the English-speaking world. As these were the countries where Irish emigrated to, a sizeable proportion were probably their children. Recent experience is obviously different, with a shift away (in percentage terms) from the old and towards the new. There has been a modest increase in EU15 population share, but most of the increase has been elsewhere. Having probably been around 10% in the early 1990s, the EU15-28 and Rest of World now account for over half of foreign-born population.

Foreign Born Nationality Ethnicity 2016

Since 2006 there have been questions about ethnicity and nationality on Census forms. The table above shows Ireland’s population by birthplace and percentage who were Irish nationals and of “White Irish” or “White Irish Traveller” ethnicity.

The “Non-National-Population” is often used synonymously with foreign-born to measure immigration, which can cause confusion as they are different. In 2016 the Non-Irish national population was 13% of population compared with the foreign-born 17.3%. From 2011-16 the non-national total fell, because there was an increase in granted citizenships after 2011 reforms. Since 1998 over 150,000 citizenships have been acquired. 38% of foreign-born people have been naturalized.

Even if nationality is no longer a good estimate of “immigration” it’s still perhaps a truer measure of the “Non-Irish” population. A caveat is that there’s a clear difference between those born in the EU and outside it, with the latter much more likely to have become naturalised. This reflects the fact that it’s harder to live and live securely in Ireland if you were born outside the Single Market.

Ethnicity is used as measure of immigrant integration. It’s a controversial and debated concept. And as a statistic it can be problematic too. In Census 2016 there were 125,000 who did not fill out the question or did so improperly, which was higher than other question non-responses. As such, the “White Irish” percent (82.8%) may be a bit higher. Another issue is that mixed ethnicities were not tabulated fully.

The “White Irish” and “White Irish Traveller” percentages does re-emphasize the fact that foreign-born include children of Ireland’s mass emigration. People who Irish-born parents or grandparents are entitled to Irish passport. They’re particularly high for English-speaking countries. Though too small to be included in the table, the share is also high for other Commonwealth or entrepôts (Gulf States, Hong Kong, Kenya, Singapore, Zambia and Zimbabwe). Again a reasonable guess is that these are the children of returning Irish emigrants. 28% of foreign-born are of “White Irish” ethnicity. It might be closer to a third if you included those with mixed/Irish ethnicity and dealt with non-responders.

Immigration from diaspora could fall if the Irish emigrant stock continues to decline. The emigration after the 2008 financial crisis was in fact smaller than the 1980s and much smaller than 1950s. On the other hand, assuming Ireland remains an open and prosperous country it will continue to attract migrants. As such, the caveats about foreign-born statistics may no longer apply in the future. But for now it’s something to bear in mind.

Posted in Uncategorized | Leave a comment

Irish Emigrant Population Statistics

Irish-Born Population Living Abroad 1841-2011

Irish-Born Population in Ireland and Main Emigrant Destinations

Irish Born Population Abroad Table

While Ireland’s population collapsed after the Famine and continued to decline into the 20th century, the total Irish-born population was obviously more stable. In the 1880-90s about 40% of those born in Ireland had emigrated. The emigrant stock did fall thereafter, as outflow declined and first-generation emigrants passed away. Those born to Irish emigrants abroad would become part of the diaspora, at least if they identified as partly “Irish”, however statistics on ethnic populations are much harder to come by.

Census data is never completely accurate. And problems get larger the older the source. It’s quite possible that Irish populations were under-counted after the Famine in some countries. Indeed under-counting was an issue in Ireland too. The 1841 Census is considered to understate the island’s pre-Famine population. A chart with Ireland’s population in 1841 (or thereabouts) at 8.5 million instead of 8.1 million was posted here. That chart shows Irish population falling because of the Famine deaths, unlike the one above.

As the bulk of the Irish emigrated to Britain and the United States, it can be difficult to show other countries’ trends in graphs with a nominal scale. The first graph in log scale, with Irish-born population living in Ireland and South Africa, is below.

Irish Born Population Log Scale

Sources

To my knowledge, the most comprehensive book on this subject is Donald Akenson’s “The Irish Diaspora”. It includes statistics on Irish emigration from mid-19th to mid-20th centuries. Another good source are the chapters in another book called “The Irish Diaspora” edited by Andy Bielenberg. The Commission on Emigration’s report (1954) also had tabulation on geographical distribution of Irish-born persons, which is below.

Table 95 Commission on Emigration

Additionally there are estimates made by academics for some of the years marked “Not available” (see country notes below). Surprisingly it’s often harder to find more recent statistics. As the number of Irish immigrants declined, counting them was perhaps not as important. Ireland is sometimes counted with the “British Isles” or “Northern Europe”. The other complication is partition. In several countries there is no data on people born in Northern Ireland, although approximations are possible.

The country notes:

  • United States: From 1960-2000: “Historical Census Statistics on the Foreign-Born Population of the United States: 1850-2000”. 2011 can be found on the US Census Bureau’s website. Northern Ireland is included in the UK total, but as England and Scotland are available to subtract from UK total, an estimate of 30,000 is used.
  • Canada: Unfortunately there’s a lack of data from 1961. There appears to be no data for Ireland from 1971-1991, only British Isles and Northern Europe. And since 1961 there has been no available data on Northern Irish-born. Damien Courtney’s estimate of 40,000 for 1991 is included. Census totals for Republic of Ireland are available on CanadaStat for 2001 and 2011.
  • England & Wales: HistPop is an excellent source for British and Irish Census until 1940s, however thereafter British Censuses can be hard to find. Akenson provides 1961 and 1971 data (page 198). And 1981, 1991, 2001 and 2011 can be found on the ONS’s Nomis website.
  • Scotland: Akenson above for 1961 and 1971. It appears that 1981 is not available online. 1991, 2001 and 2011 can be found on Scotland’s Census website.
  • Australia: Estimates for 1851 come from Damien Courtney and 1861-71 is from Charles Price’s 1984 working paper. Australian Censuses from 1911 to 2016 are available on the Australian Bureau of Statistics website.
  • New Zealand: Akenson has data from 1881 to 1951 (page 68). 1961, 1971 and 1981 are not available online at present. Census data for 1991, 2001 and 2013 (2011 Census was cancelled because of the Christchurch earthquake) can be found on StatsNZ.
  • South Africa: Not included all visualizations, as Irish population was usually below 10,000, but Irish-born data can be found Akenson (page 134) and Donal McCracken’s chapter in “The Irish Diaspora” (screenshot can be found here). According to StatSA (via email) the number born in “Ireland” was 4,704 in 2001 and 3,478 in 2011.

Rest of World

The data visualizations include the bulk of Irish emigrants to the present day. However, thousands also emigrated to other countries. Andy Bielenberg’s rough estimate of “Other Overseas” emigration was 38,000 between 1815 and 1910. There were small Irish communities in Latin America, especially Argentina. Estimates of the Irish Argentine population vary considerably, though it’s likely that a couple thousand Irish-born lived there in the late 19th century.

The Irish featured prominently in the British Empire. As noted hundreds of thousands settled in Australia, Canada and New Zealand. The Irish often had a disproportionate share of army, civil service and commercial jobs in the Empire. About 40% (16,000) of the army and company soldiers in 1850s British India were Irish-born. The Indian Census counted 16,000 Irish in 1871 and 12,000 in 1911.

Irish presence in continental Europe was small in the 19th and 20th centuries, though possibly amounted to a couple thousand overall. It should be possible to do a long-term series for the larger countries, but data is not readily available, at least in English. Today there are several thousand in every medium to large EU country. As long as freedom of movement remains these populations are likely to grow.

The United Nations estimated that there were 880,000 Irish-born living abroad in 2015. (Note: this should be Republic of Ireland only, so it’s lower than the table above). Almost 90% live in the countries mentioned at the start, but the numbers living in the rest of the world is rising. In 1990 about 95% of Irish emigrants lived in Britain, North America or Australia/New Zealand.  And as Ciara Kenny of Irish Times notes, the UN figures do not have figures for Asia and Middle East, which may now be home to 12,000 Irish people.

Again, there a lack of data for Northern Ireland. But assuming their inclusion would increase the Republic of Ireland’s total by a quarter puts the numbers living in the ‘non-traditional’ places at easily over 100,000. This would imply that there’s over 1 million Irish-born (32 counties) people living abroad today.

Posted in Uncategorized | Leave a comment

Irish Migration since 1825

Migration in Ireland 1825-2016

Migration Rates in Ireland 1825

Sources: Commission on Emigration; Reports of the Register-General; CSO; NISRA

The graphs above use two sources. First, the emigration statistics are from the Commission on Emigration (for 1825-1850) and Irish Register-General (for 1851-1913) [1]. Emigration (or “gross emigration”) is expressed as a negative number here. Secondly, net migration (immigration – emigration) is the annual residual from population change less natural increase (births – deaths). It starts in 1864 – the year Irish vital statistics are first available [2]. For consistency after partition, 32 county data is used throughout. In other words, after 1922 the annual net migrations of Northern Ireland and the Republic of Ireland are added together.

The graphs’ sources certainly have their problems. Nineteenth century emigration statistics are usually considered to be underestimates. If more accurate totals existed the emigration line would definitely be pushed down a bit in most years (i.e. emigration would be higher). And the same may be true of net migration because of the underreporting of births in the 19th and early 20th centuries. But the broad picture would probably look similar.

Nonetheless, migration graphs are perhaps the single best illustration of Irish history the last 200 years. Even if understated, the emigration line clearly shows the exodus during and following the Great Famine. There were additional emigration spikes in the 1860s and early 1880s – the latter partly explained by the 1879 mini-famine and agricultural depression.

While tens of millions migrated from Europe to colonies and ex-colonies abroad, the outflow of people from Ireland was extraordinary. From 1850 to 1913 the Irish emigration rate was more than twice that of any other European country. This multiple would be greater if the period from the end of the Napoleonic Wars to the start of World War I was counted. Overall about 8-9 million left Ireland in the century before independence and partition.

Overseas emigration Baines

Source: Dudley Baines, “Emigration from Europe, 1815-1930”, page 4

The emigrant flood did subside somewhat as the 19th century was drawing to an end. By the 1900s Norway, Italy and Scotland had higher rates. There was also more emigration in parts of Central and Eastern Europe, such as Galicia and Poland. Several reasons have been proposed for Ireland’s slowing emigration – economic and political rights for Catholics, land reforms, industrialization of north-east. Economic historians have pointed to rising living standards of the time. Hatton and Williamson explained it narrowing wages between Ireland and other English speaking countries. Another factor may have been that many who wanted to leave or were potential emigrants had already left. The exodus from 1840s was still within living memory. Yet of course the falling rates were from extreme levels, and as the chart shows, Irish emigration was still among the highest in Europe.

Annual Net Migration Rate North and South

Sources: Reports of the Register-General; CSO; NISRA

Comparisons between what became Northern Ireland and the Republic before partition are possible thanks to Irish vital statistics being reported on a county/district level from 1864 [3]. All of which is made easier by the fact that Saorstat statisticians included long-term 26 county data in their early reports. Because of net migration volatility the World War years are excluded. There’s a notable spike just after partition in 1922/23, partly because of movements of army personnel. For 26 counties this would include emigration of Protestants and people connected to the UK administration in Ireland (e.g. civil servants, police, and their families).

Before partition, net migration was usually lower (i.e. emigration higher) in the 26 counties than in the 6 counties. Indeed this was the case until the early 1970s, when the outbreak of The Troubles resulted in sustained Northern emigration. Migration has generally been more variable in the 26 counties since the Famine. Independence did not stop people leaving, as evident during the downturns of the 1950s, 1980s and 2010s. But there have also been large inflows during the 1970s (mainly returning Irish emigrants) and 1990/2000s (mainly non-Irish immigrants). The latter was the first substantial immigration into Ireland since the plantations of the 17/18th centuries and exceed immigration rates seen in other EU countries (e.g. UK and southern Europe).

For most of the 19th and 20th century Ireland was a place many wanted to leave. It’s only recently that it has become a place many want to come to.

[1] Emigration:

  • 1825 to 1851 is from the Commission on Emigration report in Table 26, pages 309-11.

The Commission on Emigration was set up by the Irish government in 1948 and published its findings in 1954. The report reproduced several long-term demographic tables. The sources given for this data was:

1 1825 to 1832 and 1835 – Reports of the Register of Shipping

2 1837 – Report of the Agent-General for emigration from the United Kingdom.

3 1833, 1834, 1836 and 1838 to 1840 – Reports of the Census Commissioners, Ireland, 1841.

4 1841 to 1871 – Report of the Colonial Land and Emigration Commissioners

The statistics for points 1, 2 and 3 represent all emigrants from Irish ports plus two-thirds who went from Liverpool for overseas destinations.

19th century emigration statistics are considered to understate the actual amount. For instance, emigration to Britain is either not counted or substantially under-counted. But as far as I am aware this is the only pre-1850s time-series of Irish emigration.

Until partition there are estimates made by the UK Emigration Commissioners (not to be confused with Irish Commission on Emigration!) of people departing British ports for non-European destinations. However, they exclude Irish emigration to Great Britain, so after 1851 Irish emigration estimates are used instead.

  • 1851-1913 is the Register-General estimates of Irish emigration from Irish ports. They were included in the annual Register-General reports, and were reproduced in the Commission on Emigration (Table 28), Vaughan and Fitzpatrick, and Ferenczi and Willcox (page 730-31). The latter is available online.

The Register-General included breakdown by county of origin from 1851 (though this is rather volatile) and by destination from 1876. Unfortunately it’s likely that these estimates are “a considerable underestimate”, especially for emigration to Great Britain. Ó Grada has suggested that total emigration was close to 5 million, about 1 million more than the Register-General’s total. With more accurate data, the emigration lines in the chart would be pushed down a bit each year.

[2] Net Migration: This is from the residual (or indirect) method, where

Population (n) = Population (n-1) + Births – Deaths + Net Migration

therefore

Net Migration = Population (n) – Population (n-1) – Births + Deaths

The data come from the Irish Register-General reports from 1864, the year vital statistics are first available. The populations are mid-year estimates, and the births and deaths are annual. A more thorough series would use mid-year births and deaths (i.e. Q2 year n-1 to Q2 year n). Quarterly data is in every Register-General report since 1864, thought it would take some time to gather. In any case the graphs would look identical. The same method and net migration residuals before partition can be found in Franz Rotenbacher’s “The European Population, 1850-1945”.

The residual method is not ideal for several reasons. It does not measure the difference between emigration and immigration. While immigration and return migration was fairly small in the 19th century, both have become important since the 20th century. A more serious problem is that the residual depends on other components being accurate, which is not the case.

There is reason to believe that the net migration was in fact lower (because emigration was higher) in the 19th and early 20th centuries. Both births and deaths were under-registered, with births probably more so than deaths. This would imply that natural increase was higher than stated, and assuming the mid-year population was correct, net migration by definition be lower or more negative. The late Brendan Walsh summarized criticisms of Irish vital statistics in this article.

After partition the net migration residuals of Northern Ireland (from NISRA) and Republic of Ireland (CSO) are added together. The same caveats above apply, though vital statistics’ errors have been reduced.

[3] North-South Net Migration: The early Free State/Saorstat Register-General reports included long-term population and vital statistics tables for 26 counties. The early Northern Irish reports were not as statistically generous, so from 1864-1900 the Northern net migrations are from 32 county minus 26 county population changes, births and deaths.

The sources north and south are:


Posted in Uncategorized | Leave a comment

The Origins of Water Charges

TL;DR: This is a rather long and tedious post about a long and tedious political controversy in Ireland. The short answer is that water charges were proposed early on in the economic crisis. They were of domestic origin, not externally proposed or imposed. Both the Fianna Fail/Green government and Fine Gael opposition supported water charges from 2009/10, before the bailout and Troika’s arrival in late November 2010.

There are many interesting chapters in the recent book, Austerity and Recovery in Ireland. One of the points made by several authors and in the introduction is as follows:

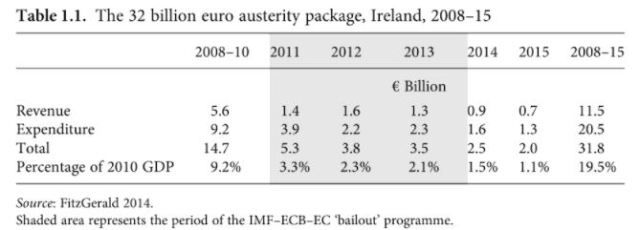
“The Irish authorities are shown to have been the main authors of austerity. The major policies agreed with the Troika had been initiated by the Irish Government before the country was forced into accepting a bailout”. (Page 6)

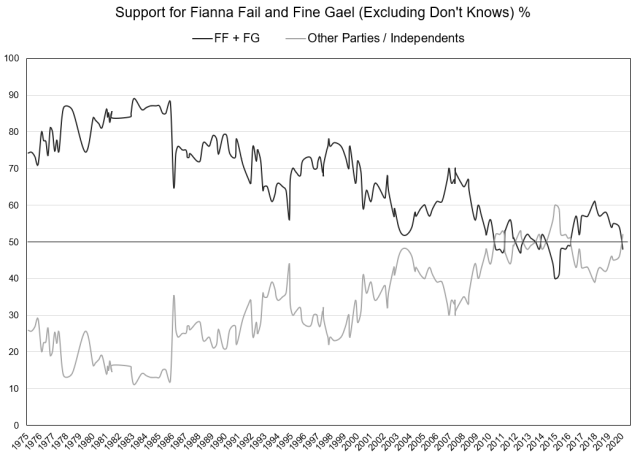
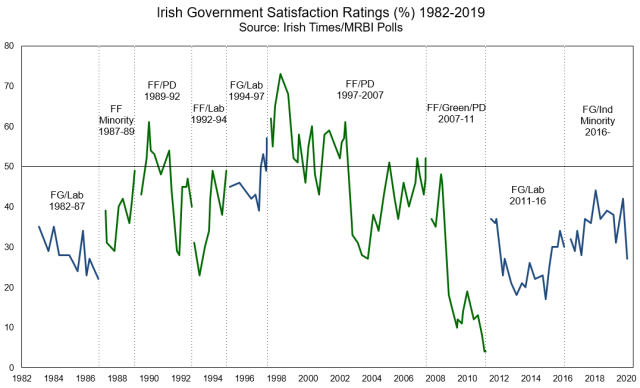
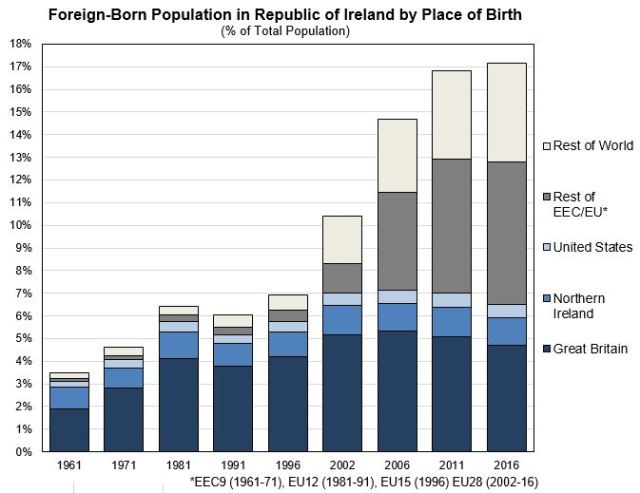
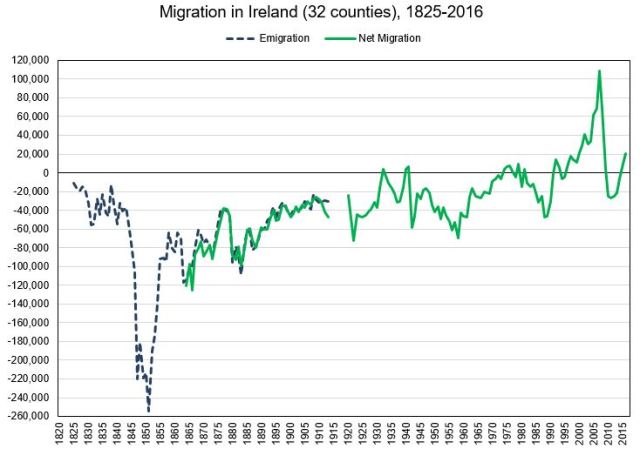
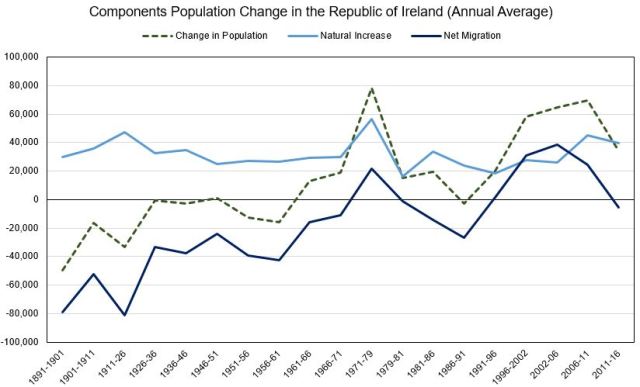
In political and public debate the narrative is often the opposite. The Troika is blamed for individual measures and for austerity in general. Its used as a scapegoat by those in government, while their opponents try to link them with hated Troika as closely as possible. There’s also an idea that government was unable to function properly without the Troika’s presence. Despite the fact that most of the fiscal consolidation had already taken place or was planned before the bailout (see chart below). The bailout was more about access to financial markets than making hard decisions.


Of all the austerity measures, water charges proved to be the ‘straw that broke the camel’s back’. And it’s perhaps on this topic that Troika-blaming happens most often (e.g.: the “brainchild of Fianna Fail and the Troika”; “a policy which originated in the Troika agreements”). A recent Dail Committee report on water services has a “Timeline of Key Decisions” which places the origins of water charges with the EU/IMF Memorandum of Understanding in November/December 2010. This is again despite the fact that charges were supported by the Fianna Fail/Green government since 2009, over a year before the Troika

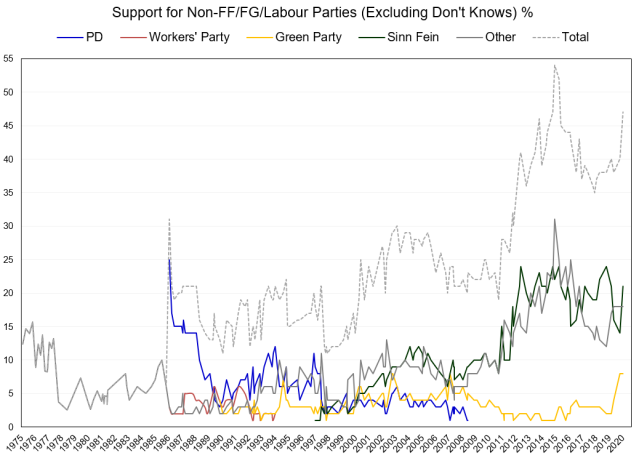
The following is a summary of party positions on water services:

  • Fine Gael: Have supported water charges officially since summer/autumn 2010. In March 2009 the party’s NewERA plan proposed to merge local authority water services into a single utility called “Irish Water”. While water charges were not explicitly mentioned in NewERA, utility charges in general were. And for Irish Water to borrow commercially (one of NewERA’s aims) charging households was necessary.
  • Labour Party: Opposed water charges in opposition and in its 2011 election manifesto, but agreed to them in the FG/Labour Programme for Government.
  • Sinn Fein: Always opposed water charges, but flip-flopped over whether paying water charges was the right thing to do after losing the 2014 Dublin South-West by-election.
  • Centre-Left/Left: With the exception of the Green Party, all left-leaning and left-wing politicians in the Dail have always opposed.

It’s really Fianna Fail’s position(s) that cause the most confusion. For instance, on RTE’s Late Debate (28th February 2017), Marc McSharry TD emphatically denied his party had signed up to water charges in the Troika’s memorandum of understanding in 2010. Over the past 2-3 years, similar claims have been made by Fianna Fail reps whenever the topic of water surfaces. Further confusion arises over the distinction between water charges (which were accepted in by Fianna Fail/Green government in 2009) and Irish Water (the semi-state utility Fine Gael proposed in opposition in 2009 and set-up in government in 2013). Sometimes confusion is on purpose. A tactic used by Fianna Fail-ers when asked whether their party supports water charges is to respond: ‘Fianna Fail has always opposed Irish Water’.

So what are the origins of water charges?

Firstly, some background. Water charges and Ireland have an unhappy history [1]. Since domestic rates were removed in 1978, any attempt to introduce a charge on water services has been met with protests, campaigns of non-payment, and eventually, a volte-face by authorities. In the 1980s urban local councils tried and failed to bring in household water charges, though they succeed in taxing businesses. In the 1990s the break-up of Dublin councils resulted another attempt by authority bosses, but again faced opposition. Joe Higgins’ narrow loss in the 1996 Dublin West by-election prompted a re-think within the Rainbow coalition. With a general election in view, councils were stripped of their power to levy water taxes in 1997. Water charges were abolished.

In the decade leading up to the financial crisis, no major party supported re-introduction. Both the Green Party and Progressive Democrats suggested support in principle, though neither included it in a manifesto or policy proposal. In any case a booming/bubble economy meant tax cuts were on the agenda not tax rises. The issue appeared completely off the table when the European Parliament (with the support of Fine Gael/EPP MEPs) voted against Council and Commission moves to force every member state to tax water consumption. The European Commission has long argued them. At the time one official complained: “Irish consumers have to understand if they want water to be free, they can drink the water that comes from the sky”.

So far they have been unsuccessful. The EU Water Directive in 2000 included a requirement for “water-pricing policies” as well as the so-called “Irish clause” in Article 9(4), allowing national discretion with “established practices”. There have recently been arguments over the exact legal meaning of the directive. But the interpretation at the Directive’s inception by Irish politicians and press was that Ireland would not have to introduce water charges.

That said, water charges never went away completely. The most notable occasion was the “Independent Estimates Review Committee” in 2002. A slowing domestic/global economy and a pre-election giveaway budget resulted in the tax take being lower and deficit higher than expected. Rediscovering his fiscal rectitude, Charlie McCreevy set up the Committee to examine areas where government expenditure could be cut. Chaired by three senior civil servants – “The Three Wise Men” – it was a similar set up to “An Bord Snip” (1987) and “An Bord Snip Nua” (2008/09). The report was published along with Budget 2003 in December 2002.

Their remit was to come up with €900 million in expenditure reductions and to slow the current rate of spending, which they believed was creating an “unsustainable deterioration in the budgetary position”. In addition they proposed extra measures in case the economy deteriorated further. One proposal was water charges:

Drinking water quality and sewerage treatment requirements are becoming more stringent and water/sanitary services are becoming more expensive to provide and operate. The absence of a charging regime on domestic consumers will continue to put pressure on the Exchequer. Moreover, the long-term objective in relation to a water and sewerage service should be to encourage more sustainable patterns of consumption. A charging regime could contribute to more efficient use of what is becoming an increasingly expensive resource. Ireland is unique amongst OECD and EU Member States in not charging domestic consumers. [Page 49]

None of the extra proposals were included in the Budget. When Joe Higgins inquired whether this meant water charges were on the agenda, Bertie Ahern replied: “…there is no proposal to bring back water taxes. I am sure the Deputy will be disappointed to hear that.” The Deputy would have to wait a decade for a protest opportunity.

However, in the New Year it emerged through freedom of information that McCreevy and the Department of Finance had attempted to include a household water charges of €200 in the Budget, only to be rebuffed by the Minister of Environment, Martin Cullen. Finance’s reasoning was close to the Committee’s. Any revenue would be given to local councils. McCreevy then went public in his support. Prompting Martin Cullen to again reject charges “out of hand”, a position all opposition parties took, except the Green Party who supported some pricing of water. Although notably one Fine Gael opposition spokesperson, Olivia Mitchell, said she personally supported charges. And Mark Brennock of the Irish Times noted that “a significant number of politicians privately support such charges”.

Another occasion where water charges were proposed in-and-around officialdom was in 2006. Indecon and University of Birmingham were asked to write a report on local council financing [2]. Like previous (and perhaps future) reports, it recommended giving councils more sources of funding, including a property tax and water charges for second hand homes. On the latter they wrote:

“The absence of any water charges on domestic residences and on certain commercial premises, regardless of the income and assets of property owners or the consumption levels of water, is not consistent with economic efficiency. It also is inconsistent with principles of accountability or equity. We believe that the current position leads to significant inefficiencies. In addition, we understand that the cost of these services is rising rapidly and is placing significant financial pressures on local authorities.

We recognise the implementation difficulties associated with this issue but believe that the introduction of water charges has strong merits. However, we do not believe that the introduction of charging for all consumers is feasible in the short term, despite its economic merits, and would recommend a targeted approach, which is more realistic.” [Page 193]

These limited charges were rejected. The new Minister of Environment, Dick Roche, welcomed the report, but demurred: “The revenue generating options identified by the consultants run counter to current Government policy”

While the above shows there was little political appetite for water charges, the same cannot be said of ‘expert’ opinion. Many economists, policymakers, and probably civil servants, supported the pricing and taxing of water consumption. The ESRI championed them in several pre-budget commentaries and policy papers. The former state think-tank Forfas gave their blessing in 2008. During the economic crisis two left-leaning think-tanks, TASC and CORI Justice (now Social Justice Ireland), supported the introduction of water charges on an equitable basis. Those with more direct involvement, and vested interest, also voiced support. For example Engineers Ireland and some managers of local councils. Chambers Ireland, IBEC and ISME wanted household charges, largely to lessen the burden placed on commercial charges, one of the few revenue sources available to councils.

Backing came from abroad too. As noted the European Commission (particularly its Environment branch) and the European Environment Agency were advocates. The OECD were persistent proponents. An Environment Performance Review in 2000 stated: “Eliminating water charges for households was a step in the wrong direction”, a line repeated in numerous reports. Re-introduction has been recommended in every Economic Survey of Ireland since 1999 and will likely feature in the 2018 survey.

water consumption per capita

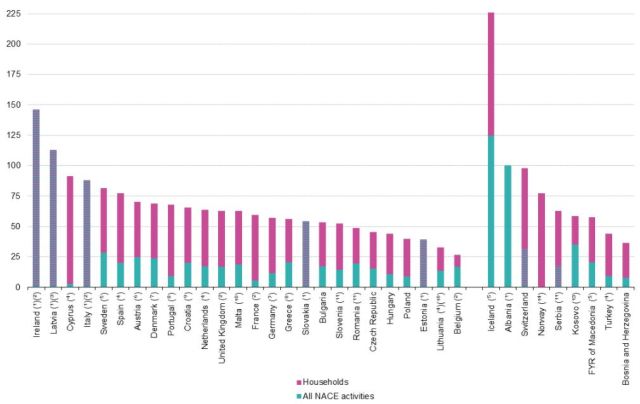
Source: Eurostat Water Statistics (Accessed, 14th May 2017). More up-to-date Irish Water metered data suggest the Irish estimate in European water survey is too high.

The fact Ireland was (and still is) the only EU and OECD country without domestic water charges was often raised by supporters. Another claim was the apparent high rate of water consumption in Ireland (see chart above). European survey statistics showed Irish businesses and households were the highest or second highest consumers of water in the EU. (As it happens Irish Water’s metered data has lowered this estimate considerably, probably below UK average and possibly below the EU average. The meters had some use after all!). So when the economic crisis hit in 2008/09, it wouldn’t have taken anyone long to come up with water charges as a new source of revenue.

Commission on Taxation – FF/Green Government

The exact origin for the FF/Green government’s adoption of water charges was the Commission on Taxation report in September 2009. The Commission actually started life before the economic crisis as part of the Programme for Government in 2007. Its remit was essentially an analysis of Irish tax system’s efficiency, and was re-run of Commissions in the 1980s, which were well received, but whose recommendations were largely ignored. A more specific purpose was designing a carbon tax – one of the Green Party’s coalition demands. The terms of references included keeping “the overall tax burden low”. However, this was amended in January 2009 with “…given the urgency of the situation and the role that taxation will have to play in bringing stability back to the public finances, the Government is asking the Commission on Taxation to identify appropriate options to raise tax revenue”. Their role essentially changed from mostly analysis to coming up with austerity measures as well.

In the months before publication there were accurate reports saying the Commission was considering a residential property tax and water charges – two taxes Ireland was an outlier in not having. The Minister of Environment, John Gormley, said the government was considering water taxes in April 2009. In July the “An Bord Snip Nua”/”McCarthy” report recommended giving local authorities independent sources of revenue, “including such measures as may be suggested by the forthcoming Commission on Taxation report”. One measure endorsed was “charging for domestic water services” under a “single national water authority”.

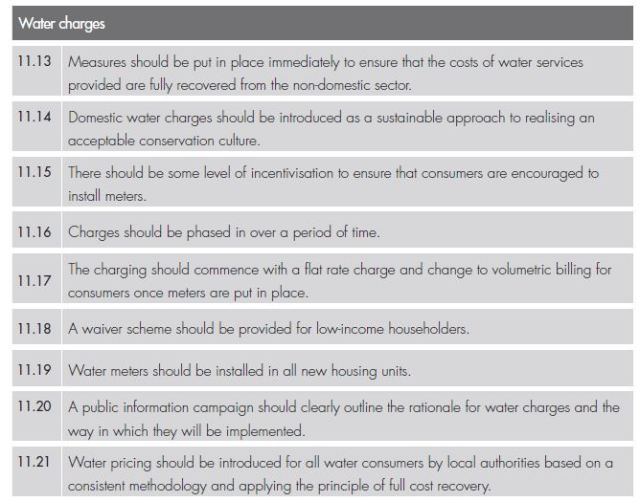
The Commission’s report was published on schedule in September 2009. Similar to many reports cited above, the Commission wanted revenue from water charges to go into local government. Noting that “some submissions to us have suggested a more universal application of water charges” they argued for a polluter pays principle. A flat-rate would apply until water metering were installed. Once meters were in the ground, charges would be determined by local authorities based on consumption. Low-income households could be granted a waiver, but were against a free allowance.  They reckoned it could bring in €400-500 million, with €58 million extra from more efficient charging of businesses. A summary was as follows:

The Renewed Programme for Government in October 2009 (the previous Programme from July 2007 was no longer feasible) opened by citing the Commission and An Bord Snip Nua reports as the inspiration for much of the austerity planned. The Renewed Programme explicitly outlines the government’s plans to introduce water charges:

“We will introduce charging for treated water use that is fair, significantly reduces waste and is easily applied. It will be based on a system where households are allocated a free basic allowance, with charging only for water use in excess of this allowance. In keeping with the allocation of greater responsibility to local government, Local Authorities will set their own rates for water use.”

A month later water charges were mentioned again in Brian Lenihan’s Budget 2010 speech:

“The Renewed Programme also contains a commitment to introduce a system of water metering for homes. Preparations are underway. Water charges, when introduced, will be based on consumption above a free allocation. Further details will be announced by the Minister for the Environment, Heritage and Local Government.

These charges, like the charge on second homes, will finance the provision of local services by local authorities.”

What a FF/Green water charging regime would have looked like was never fully clear. The date of implementation was gradually pushed forward to “after the 2012 general election”. In the National Recovery Plan, published on the eve of the bailout, the government said metering would start in 2011 and charging in 2014.  Charges from €300-€500 were reported. Initially charging would occur through councils, though according to cabinet papers obtained by RTE, the government approved a “national water agency” in September 2010. This may have been a quango as opposed to a semi-state (like Fine Gael’s Irish Water) as local authorities would continue to be responsible for direct provision. However, the Memorandum of Understanding with the Troika in November 2010 stated:

“The government will have undertaken an independent assessment of transfer of responsibility for water services provision from local authorities to a water utility, and prepare proposals for implementation, as appropriate with a view to start charging in 2012/2013. “

Despite cabinet approval and Troika agreement, water charges were not included in Budget 2011. The government had plenty of things occupying its mind, but there might have been political calculations going on. There were legitimate fears that introducing water charges would leak votes. Every member of the cabinet would have been able to recall the water wars of the 1980s and 90s. In September 2009, Joe Higgins accurately warned: “Should the government attempt to reintroduce the hated water charges which we worked so hard to abolish in the 1990s, we promise them a major water war”. It’s notable that the two taxes that caused to most unrest – the household charge (now property tax) and water charges – were not introduced during the FF/Green government’s time in office. (Though it is of course true the government brought in a wrath of austerity measures). Politics was also clearly behind Fianna Fail’s later opposition to water charges and denials they ever supported them.

Nonetheless, plans for water charges at least were at a fairly advanced stage by the time of the general election in February 2011. For example, Minister Gormley had had meetings with companies to install metering. Including Siemans, who offered to install for future compensation. An offer that would become part of the Irish Water controversy. While “water charges” were not mentioned in Fianna Fail’s 2011 manifesto, installing water meters as part of an infrastructure stimulus plan were. It obviously makes no sense that they opposed water charges, but supported installing meters! The simple fact is that Fianna Fail publicly and privately supported water charges from 2009 to 2011 and made significant progress before the coalition’s collapse in the winter 2010. Claiming otherwise is simply false.

Fine Gael’s NewERA Plan

Of more relevance to what actually happened from 2011 is Fine Gael’s NewERA plan. In debates and speeches, Fine Gaelers were often found carping on about the government’s austerity measures. Yet they supported the bulk of fiscal consolidation in their opposition proposals and then government policies. Indeed the current Taoiseach advocated for shaper austerity. The NewERA plan was first published in March 2009 (no PDF of the original is available online). It was mainly about reorganizing the management of state and semi-state companies and included some privatizations. It was advertised as “€11 billion” stimulus plan, creating “100,000 jobs”. (Estimates Michael Noonan would later disavow after becoming Fine Gael’s Finance spokesman). Simon Coveney was in charge of formulating the contents. On water it proposed consolidating services from the 34 local authorities into a single utility called “Irish Water”. A deteriorating economy prompted the party to somewhat revise the plan. The November 2009 version said:

“NewERA will invest €4.2 billion to upgrade Ireland’s water infrastructure. We will deliver real economies of scale by bringing all of Ireland’s water assets under the ownership of one State company, “Irish Water”. Ireland currently spends €700 million (excluding capital expenditure) each year to produce clean drinking water. Yet around 43% of water is wasted through leakages in the water system. The fragmented nature of the water industry, in which 34 local authorities are responsible for investment and maintenance, also means that there are currently no real economies of scale.”

An advantage of a separate entity in water and other utilities was that they could then borrow commercially and be off the state’s balance sheet. The plan did not explicitly mention water charges, but did implicitly.

“NewERA is a long-term financial investment by the State in commercial sectors of the economy – energy, telecoms and water – that can ultimately earn a financial return. In nearly all advanced economies, it is considered both fairer and more efficient that services in these sectors be paid for through user charges on households and businesses, rather than through general taxation. That is why these investments do not count as Government expenditure. The investments are reflected on the balance sheet not of the Exchequer, but of the NewERA companies, where they should be.”

The NewERA hints aside, Fine Gael did not officially commit itself to water charges until well into 2010. In an interview with Newstalk in January 2010, Enda Kenny was unable to answer whether his party were in favour of charges. This ‘gaffe’ was used against Kenny in the heave that summer, although I cannot find any mention of a Fine Gael spokesperson (pro or anti-Kenny) clarifying the party’s stance. The official line was clarified in summer/autumn of 2010: Fine Gael supported water charges, after meters had been installed. Once again, this all happened months before the Troika arrived in Ireland.

Like the FF/Green government, the FG opposition were not entirely clear about what their water charging regime would look like. Only a “fair funding model” was mentioned in its 2011 manifesto. Indeed it took until the last year of their coalition government to come up with one. And what they came up with – a flat rate minus conservation grant – was actually opposed by Kenny in 2010. Reacting to a proposal by the Department of Finance in summer 2010 to introduce a flat-rate before meters were installed, Kenny said it was “unfair, inequitable and is not environmentally sound, with the poor paying the same as the rich”. So Fine Gael were in favour of water charges, but didn’t know what to charge.

***

By the time the Troika arrived in Ireland in late November 2010, water charges were already the official policy of both the government and main opposition. The utility company the next government would set up – Irish Water – had been Fine Gael policy for nearly two years. Future cabinet papers or memoirs may show significant Troika involvement on water services, but contemporary press reports indicate the Troika was largely going along with whatever the government of the day was planning. The Troika memorandums contained fairly brief comments about the introduction of water charges. The more detailed research/update articles were mostly commentary on what the government was doing.

In any case, Troika agreements were not sacrosanct. Water charges were fairly small in the overall budgetary scheme of things. And the revenue stream would only be achieved in the medium to long-term. Their effect on main economic indicators was always going to be small. It’s not difficult to imagine a government delaying. The incoming FG/Labour coalition was able to reverse the minimum wage cut agreed by FF/Greens a few weeks before. Troika demands for forestry privatization and legal service reform were never carried out. Pat Rabbitte has blamed the Troika for pressurizing the government into setting up Irish Water too quickly, which may turn out to be valid. Yet the government still took years to set it up.

Two members of the Troika – the European Commission and ECB – can certainly be blamed for their actions and lack of actions during the economic crisis. However, it’s difficult to imagine a post-2008 Ireland without some budget cuts and tax rises. Even if Ireland was allowed to “burn the bondholders” or was given economic slack from Europe, there would still have been a significant budgetary deficit. And to plug the fiscal hole, water charges would have always been high on the list of policies. The Irish water debacle was made in Ireland; foreigners should not be blamed.

[1]. For a good history, see Colm Murphy’s prescient Dublin Review of Books article, “Ireland’s looming water crisis”, from 2009. For a good article on water controversies in 1990s Dublin, see Nicky Ryan’s article at the TheJournal.ie. At least with Irish water charges, history does appear to repeat itself!

[2] There have been a number of reports on local council funding over the years. All have recommended decentralization and greater fiscal autonomy for councils. Among other measures, water charges were proposed in a reports by KPMG (1996), Indecon (2006), and in the Commission on Taxation (2009). These recommendations were rejected by government.

Posted in Uncategorized | Leave a comment

Net Migration in Ireland and the UK

net-migration-ireland-and-uk

Sources:

Economic and social statistics are usually best illustrated comparatively. A country really only knows itself when compared to its peers. And the flow of people in and out of a state is one important indicator. In recent years, immigration has been a major political issue in the UK. While emigration has been a focal point in Ireland for almost two centuries.

Unfortunately long-term statistics on migration are not always available. Because of a lack of standardized methodology in calculating migration, there is reason to be skeptical about the estimates cited above, including recent data. The techniques used by the British ONS have been labelled untrustworthy – sometimes by the ONS themselves. The Irish CSO’s methodology is a bit broader, but the last two Irish censuses have shown its annual migration estimates to be faulty. Nonetheless, the graph will hopefully give an accurate picture of the trends and scale of net migration, even if the exact numbers are suspect.

Net migration was negative in Ireland and the UK for most of the 1950s to the early 1980s. From the 1990s net migration turned decisively positive in all countries, except the two Irelands after the financial crisis.  The most volatile migration is clearly the Republic of Ireland. Overall emigration there has been the largest, but so too was immigration in the 2000s. The only other spike was Northern Ireland during the onset of the The Troubles in the late 1960s and early 1970s. The variation on Scotland and the UK has been much less.

Ireland may have another surge in immigration if its economy improves. And Brexit limits access to the UK, a major immigrant destination. Although, unfavorable electoral results across the Irish Sea and Atlantic may result in a downturn and further emigration. History suggests the swings will continue to be large.


Posted in Uncategorized | Leave a comment

Census 2016

Term Report

Preliminary results for Census 2016 were released on 14th July by the Central Statistics Office of Ireland (CSO). The initial results include estimates for country and county population, net migration, and housing. More detailed stats will be available from March/April 2017.

In the next 5 years the Census will often be used by policymakers to determine where resources should be allocated. And ideally the data will help inform debates on issues such as housing, migration and religion.

But as well as the practical uses, new Irish censuses provide an update on Ireland’s unusual demographic time-series. The Republic of Ireland is the only developed state whose population now is lower than its mid-19th century level. Mary Daly has suggested that Ireland is the only country whose Census results draw immediate comparison with the 19th century. The press certainly obliged, with The Irish Times headlining with “Population at highest in over 150 years despite high migration”.

Past censuses had political importance too. Irish public figures were well aware that Ireland’s population decline was at odds with most of the UK and Europe. Before independence blame was attributed to misrule from London. So it was somewhat embarrassing that rule from Dublin did not stop the decline. To add insult to injury, the population of the 6 countries that became Northern Ireland saw its population rise again in the 1890s. In the 26 counties there was a minor population increase in 1951 Census, but it was not until 1966 that there was a sustained increase.

The magazine Dublin Opinion had a number of demographically themed cartoons in the 1950s when emigration was soaring. The above example, “Term Report”, depicts the Taoiseach Sean Lemass as a schoolboy entering a classroom. At the door is a teacher (representing Ireland) with a copy of “The Census” in her hand. For much of the 19th and 20th centuries the country failed its tests.

With the importance of the Census hopefully established, below is some brief analysis and graphs looking at the past and present of Irish population. (The future will be available when the CSO update their projections, probably in 2018).

  • Ireland’s Population Change, 1821-2016

Population of Ireland, 1821-2016

Population Growth Rates in Ireland

Sources: CSO, NISRA, W.E. Vaughan & A.J. Fitzpatrick, Irish Historical Statistics: Population 1821-1971Wikipedia has some of the figures.

4,757,976 people were enumerated on Census Night, Sunday 24th April 2016. Representing an increase of 169,724 people since Census 2011. The growth rate of 3.7% is marginally below the post-Independence growth rate of 3.9%.

To allow for comparison and for pre-1922 consistency, Northern Ireland is included in the above graph and chart. Because Irish Census is every 5 years and the UK Census every 10 years, the figure in-between are NISRA’s estimates. The most recent Northern Irish total for 2015 of 1,851,600.

Consequently, the island of Ireland’s population in 2015-16 can be estimated at 6,609,576. This is the highest level since the 1851 Census and probably the late 1840s when the population was collapsing. But still well short of the approximately 8.5 million in 1845. NISRA and UN projections (that require a large grain of salt) suggest reaching the pre-Famine peak may be possible towards the end of the century.

  • Components of Ireland’s Population Change

components-of-population-change-in-republic-of-ireland

                     Sources: Census 1971 (1891-1926) page 1, CSO (1956-2011), CSO (2016)                                Note: Net Migration above zero means immigration exceeds emigration. And vice-versa for below zero.

births-and-deaths-in-the-republic-of-ireland

The Census revealed almost 100,000 more people living in the Republic of Ireland than previously estimated. The CSO’s annual population estimate in August 2016 had total population at 4,670,000. All six of their projections made in 2013 fell short of the actual figure.

The main reason is that net migration (immigration less emigration) was not as negative as thought. There was still a sharp fall in net migration of -28,558 (-5,700 annually), turning negative for the first time since 1986-1991. But this was higher than the -100,000 or so that was predicted. Population change consists of natural change (births less deaths) and net migration. Because annual stats on births and deaths are considered trustworthy, the Census’ net migration figure is a residual (population change less natural change).

At fault was the CSO’s annual estimates, which are based on analysis of the Quarterly National Household Survey, visas issued, and PPS and UK National Insurance numbers. A sample can give a good picture of a population’s characteristics, but estimating its size is trickier. Ireland is not alone in having trouble measuring migration: similar problems have occurred in the UK.

It will be interesting to see whether net migration was higher because of fewer emigrants or more immigrants. Or a bit of both. Since the financial crisis there has been an abundance of anecdotal evidence about emigration. Leaving the explanation to non-Irish immigration, perhaps driven by non-EU nationals. The answers will be provided in the Spring’s detailed reports.

Net Migration varied widely by county. Cork, Dublin, Laois, Longford and Kilkenny were the only counties to see positive net migration. (County measures include migration within Ireland, e.g. from rural parts to Dublin). Within counties there was a clearly more inflows into urban areas. Cork City had a net inflow of 4,380, while Cork County had outflow of -2861. More urban counties (Carlow, Louth, Meath, Wicklow) had negative net migration only in the hundreds. Dublin had the largest inflow of 7,981, although Dublin South was the only local authority region with negative net migration of -4,217. Donegal, which often performs badly on economic and social metrics, had the largest outflow at -6731.

As the first graph shows, change in population has historically been largely determined by swings in net migration. Natural change has varied, but not in the same degree as migration.

The second graph shows the composition of natural change. The birth-rate has exhibited variation. There was a baby-boom in the 1970s and this cohort (along with immigrants of similar age) is responsible that hike in births in the late 2000s. Though declining during 2011-2016, the birth rate started off in an elevated positions. So it was expected that Ireland’s population would increase, regardless of emigration. Along with the rest of the Western world, birth rates will probably fall in Ireland, resulting in a smaller baby boom forecast in the 2030s. The number of deaths in Ireland has fallen a bit over the years thank to medical and public health improvements. A stat that looks even better when the increased population is considered and is measured as the death rate per 1000 persons.

  • County Population and Rural Ireland

Last Census with Population Decline

2011-2016 was the first period since 1991-1996 where there was population decline on a county level. This occurred in 3 counties: Donegal (-1.5%), Mayo (-0.2%) and Sligo (-0.1%). The above chart shows the last Census year counties suffered falling numbers of people. There is a clear urban bias, with more rural counties suffering declines more recently. Dublin is the notable outlier having last seen a fall in 1871. It was the 1960s for most of the counties bordering the capital.

For comparison Northern Ireland is included again. (Since the 19th century Irish and then Northern Irish censuses counted Belfast city as a distinct entity. So the Co. Antrim and Down population totals exclude the city). Population in the 6 counties recovered much faster than the rest of the country, in large part because the north-east was the only part of the island to industrialize. But subsequent de-industrialization and the Troubles have caused more recent falls.

50 years of urbanization

Source: CSO, This is Ireland: Part 1 (2012), page 13

Irish population decline has always been associated with rural depopulation. Although Ireland remains one of the most rural countries in the OECD, the bulk of modern population increase has been urban. As the above chart shows, rural population has been stagnant in the last 50 years, though if small towns are defined as ‘rural’ there has been a modest increase. According to the CSO’s definition of urban (an area with +1,500 people), Ireland officially became more urban than rural in the 1960s.

The flight from the countryside to cities has occurred in every developed and most developing countries. In a sense Ireland is still catching up with its peers, many of whom industrialized and urbanized over a century ago. Indeed the unusual part of Ireland’s demographic history is not that Irish people migrated from rural to urban areas, but that they went to foreign cities instead of Irish ones. Although statistics are not readily available, one would suspect that since the financial crisis most rural Irish emigrants have not gone to other urban areas in Australia, Canada and the UK.

Given Ireland retains a large rural population, increased urbanization is difficult politically. The plight of rural Ireland was a prominent issue during the 2016 General election. All parties are now promising to devote more resources to rural parts and it’s likely that future Budgets will be favourable. This is not surprising: with the exception of 44 Dublin TDs (and perhaps a few of the Cork City based TDs), the rest of the 114 members of Dail Eireann have significant rural areas in their constituencies. And it is not unreasonable for these rural constituents to lobby for funds.

Public debate has tended to conclude that there has been little or no recovery in rural Ireland, i.e. outside the M50 or past the Red-Cow roundabout. It’s an alleged fact that has been cited as a reason for Fine Gael’s poor election. Such claims have been challenged by the economists Dan O’Brien (mostly focusing  on a county level) and Stephen Kinsella (on Eurostat-Irish regions), who point to the economic statistics showing a fairly widespread recovery. For instance, the agriculture sector is the only sector to have recovered to its pre-crisis employment peak. (Michael Taft has noted, however, that private sector employment growth outside Dublin has been slow).  An exception is the West of Ireland. Here employment growth has not been strong, and as mentioned three north-western counties suffered emigration driven population falls. The “whingers” Enda Kenny met in Mayo probably had a point. So while claims about no recovery outside Dublin are false, there’s probably some truth in a “two-speed recovery”.

A final point concerns the definition of “rural”. The CSO defines rural areas as “all areas outside clusters of 1,500 or more inhabitants”. In 2011 that resulted in a rural population of 1,741,370 (38% of total). Using the OECD definition of 150 persons per Km2, Mary Gilmartin and David Meredith find a similar number of 1,890,000 (41%). A more expansive concept can be found in the terms of reference for the Commission for the Economic Development of Rural Areas, which defined rural Ireland as all areas outside the boundaries of the 5 largest cities (Cork, Dublin, Galway, Limerick and Waterford). Meaning rural Ireland accounts for about two-thirds of the country’s population. In truth, it often feels like it is everywhere except Dublin.

Despite different definitions, it’s actually on a micro-level that will probably show rural decline most clearly. In the Examiner, Eamonn Pitts did some Census analysis on electoral divisions, showing that more rural areas contrasted poorly with urban ones. Something that may be confirmed in the All-Ireland Research Observatory’s spatial map. As such focusing on a county or regional level may hide rural-urban divides within boundaries.

Ultimately the evidence suggests that some “rural” parts are doing poorly and some okay. Even within county borders. However, as indicated by the expansive CEDRA terms of reference, politicians (and many people) consider rural Ireland to include most of the country. And in turn believe that their constituents deserve more resources. Yet rural advocates run the risk of expanding their constituencies too widely. They may find that on an aggregate level their “rural” area is statistically doing alright. The current or next government will likely set up yet another CEDRA-like commission. It will have newer data at its disposal next year.

Posted in Uncategorized | Leave a comment

United Ireland Polls

In November 2015, the BBC and RTE jointly carried out a poll and programme on a united Ireland. The poll, carried out by Behavioural and Attitudes, asked a thousand people in Northern Ireland and a thousand in the Republic about the constitutional question and other issues. [The main findings were posted by Mick Fealty at Slugger O’Toole ; full Report here].

Such polls are carried out every year or so. Previous include the BBC in 2013 and Belfast Telegraph in 2014. As well as being interesting to those interested in the subject, they serve a practical use. Under the Good Friday Agreement, the Secretary of State for Northern Ireland may hold a border poll if:

“at any time it appears likely to him that a majority of those voting would express a wish that Northern Ireland should cease to be part of the United Kingdom and form part of a united Ireland”.

The BBC/RTE poll suggests that a border poll – let alone a united Ireland – is unlikely in the near future. In Northern Ireland, re-unification in the short to medium term received minority support, not only in the province as a whole but also among Catholics (unfortunately religion remains a very good indicator for political stance in Northern Ireland, as the results below demonstrate). The status-quo – devolution – was most preferred. Though a sizable minority opted for direct rule from London.

[Northern Ireland] In the short to medium term, do you think Northern Ireland should …
Catholic Protestant Other/None Total NI
Direct Rule 14% 30% 32% 24%
Devolution 38% 49% 27% 42%
United Ireland 27% 3% 6% 13%
Other 3% 0% 6% 3%
Don’t Know 18% 15% 29% 18%
Behavioural & Attitudes (page 638)

Excluding Don’t Knows, Direct Rule had 30% support, Devolution 51%, United Ireland 16%, and Other 3-4%. Thus Northern Ireland remaining as part of the United Kingdom in the short to medium term was supported by at least 81%. Again, only a minority of Northern Catholics and a tiny minority of Protestants chose a united Ireland.

Predictably, the Republic of Ireland was more enthusiastic about a 32-country state. Excluding Don’t Knows was as follows: Direct Rule 11%, Devolution 44% and United Ireland 45%. A larger majority south of the border said they would like to see re-unification in their lifetime.

[Northern Ireland] Would you like to see a united Ireland in your lifetime?
Catholic Protestant Other/None Total NI
Yes 57% 12% 18% 30%
No 14% 68% 37% 43%
Don’t Know 29% 20% 44% 27%
Behavioural & Attitudes (page 643)

Nationalists/republicans were largely disappointed and unionists content with the Northern Irish results. And like previous polls (see below) some commentators, politicians and members of the public set out to discredit the poll on social media. However nationalists may be happier with results from the question “Would you like to see a united Ireland in your lifetime”. Excluding Don’t Knows (which at 27% was large for this question): Yes 41% and No 59%. Reunification evidently remains an aspiration for most Northern Catholics, even if a sizable minority said No or Don’t Know.

Protestants are more decisively against a united Ireland than Catholics are in favour of it. Yet the 12% of Protestants who would like to see it is noteworthy. It’s possible that some meant a united Ireland under British rule, but this is unlikely. A 2014 Belfast Telegraph – Lucid Talk poll similarly found that 10% of Protestants would like to see “unity in 20 years”. So a few Protestants appear to be open to the possibility.

Regarding Catholics, the above findings may seem innocuous. For decades most Catholics voted for the SDLP who advocated power-sharing. Now that this goal has been achieved, despite its ongoing fragility,  most in that community are fairly content. At the same time a united Ireland remains an aspiration for most.

This intuitive narrative has been contradicted, however, by the the most regular poll on public opinion in Northern Ireland: the Life and Times Survey.

life and times catholicslife and times protestantsSource: Life and Times Survey (NIRELND)

As can be seen above, when asked about “long-term policy for Northern Ireland”, a united Ireland has minority support from Catholics and minuscule support from Protestants. In fact in 2014 barely a third of Catholics wanted a united Ireland in the long term. So in terms of aspirations, the BBC/RTE poll said something different. Which may provide some solace to committed nationalists and republicans.

Previous Polls

As mentioned by Susan McKay on the live programme and Diarmuid Ferriter in an Irish Times article, the BBC/RTE poll is nothing new. Citing John Whyte’s Interpreting Northern Ireland, Ferriter notes that:

“…Whyte identified 25 polls between 1973 and 1989 about the North’s constitutional status, and there were broad consistencies. A united Ireland had minuscule support from Protestants, far from complete support from Catholics, and the solution that attracted most support from both communities was power-sharing”.

A selection of these polls were reproduced in Jennifer Todd and Joseph Ruane’s The dynamics of conflict in Northern Ireland:

protestants' first pref

catholics first pref

There were differences, often because of events or trends. Power-sharing gets majority support from Catholics in 1974, the year of Sunningdale Agreement. Support for a federal Ireland among Catholics and majority rule among Protestants also come and go. (A big drawback from the two bar-charts is that the same questions were not asked in each poll).

Still, there are clear “broad consistencies” between polls since 1968 and the BBC/RTE poll half a century later. Quoting John Whyte who was writing in 1990 (page 82 of Interpreting Northern Ireland):

“The option which attracts most widespread support in both communities is power-sharing. Among Catholics, it has normally been the most first preference, with percentages selecting it usually in the thirties or forties. If asked whether it is acceptable, percentages rise much higher – to 88 in April 1974, 83 in January 1978, 75 in May 1982, 78 in January 1986, 78 again in February 1989. Among Protestants, positive support has been considerably lower – normally in the tens or twenties. But the percentage finding it acceptable has been larger – 52, 51, 45, 61, and 57 in the five polls just cited”

Power sharing had long been the most supported option for Catholics. Protestants, who probably narrowly voted in favour of the Good Friday Agreement, were less sure. Again citing Whyte (page 80), there tended to be “widespread support” among Catholics for a united Ireland as a long-term objective. While Protestants showed little support, apart from stray polls, like in 1982 when 15% said they could accept a federal united Ireland. So despite the Troubles, the Peace Process, and large shifts in support for parties, public opinion on the fundamental constitutional and political questions has remained remarkably similar during the past 50 years.

Despite regular comment that these polls are faulty, the fact that similar findings have been repeated so often makes complaints silly. For a majority of Northern Irish Catholics, a united Ireland has always been a long-term goal. The problem for Nationalists is that the long-term in the 1960/70/80s is now. Reunification is an aspiration, but its fulfillment keeps being pushed into the distance. Protestants are more coherent in their opposition to a united Ireland than Catholics are in their support. It’s for these reasons that the Union appears to be safe.

More to reunification than economics?

The only new question in the BBC/RTE survey was on whether tax would be higher, lower or the same in a united Ireland. Arguably this is a superficial question. Particularly for those who desire a 32 county socialist (or at least left-leaning) republic where everyone would “pay more tax” for greater state involvement in the economy and society. But the question is probably a good proxy for how support changes when the economic success or failure of reunification is considered. After all, lower taxes, whether income tax or water charges, is the mainstay for all the main political parties, North and South.

Higher taxes is hardly an unrealistic scenario if partition was ended anytime soon. The billions London transfers to Belfast each year would have to be matched. And there would certainly be other costs, such amalgamating public services and extra security to deal with any Loyalist unrest. Something akin to the post-1990 German Solidaritätszuschlag (Solidarity Tax) would be required. The old solution from nationalists/republicans that it would all be paid for by UK reparations and/or EU and US aid is unrealistic. At least at the levels that would be required to run a newly reunified state. In any case, as shown in the tables below, the question has significant results.

[Republic of Ireland] And would you be in favour or again a united Ireland if it meant..
In favour of a UI Against a UI Don’t Know
Pay less tax 73% 8% 18%
No change 63% 14% 24%
Pay more tax 31% 44% 25%
Behavioural & Attitudes (page 411)

The change in support and opposition is starkest in the Republic. Excluding Don’t Knows, opposition was only 9% when “Pay less tax”, rising to 18% when “No change”, and to a majority of 59% when “Pay more tax”.  Southern support for irredentism is clearly qualified by how much money one will gain or lose. Self-interest trumps nationalism.

[Northern Ireland] And would you be in favour or against a united Ireland if it meant…
In favour of a UI Against a UI Don’t Know
Pay less tax 32% 39% 27%
No change 22% 45% 30%
Pay more tax 11% 56% 30%
Behavioural & Attitudes (page 644)

Support for a United Ireland also falls in Northern Ireland when it’s proposed taxes will be higher. But the answers for “Pay less tax” are perhaps more revealing. Breakdown by religion is below.

[Northern Ireland] “And would you be in favour or against a united Ireland if it meant you would have to pay less tax.
Catholic Protestant Other/None Total NI
In favour 57% 15% 21% 32%
Against 11% 63% 33% 39%
Don’t Know 30% 19% 44% 29%
Behavioural & Attitudes (page 649)

Like their southern brethren, Northern Catholics enthusiasm declines for a united Ireland when more tax is required. But it’s worth comparing the above table on “And would you be in favour or against a united Ireland if it meant you would have to pay less tax” with the second table in this post “Would you like to see a united Ireland in your lifetime”. (The reason the former question does not add up to 100% is because 2% “refused” to answer the tax question, for some reason).

The two questions broken down by religion reveal very similar results. Catholics support for a united Ireland is about the same when the question is about lifetime aspiration and when it’s proposed that they would pay less tax. And Protestant opposition is about the same for both questions. So even when it is proposed that reunification would make people better off, opinions do not change. A possible conclusion, therefore, is that Catholics/Nationalists’ opinion on re-unification is elastic when tax is taken into account, whereas Protestants/Unionists stance is inelastic. In other words, Unionists are still opposed to a United Ireland even when it’s possible they would be more prosperous.

This result (admittedly in only one poll) is not good for a strain of nationalist thought that has been dominant in the southern establishment. The idea being that if the Republic prospered, northern Unionists would be more inclined to support (or at least acquiesce in) the reunification of Ireland. The thesis’ voice grew in the 1950/60s and is associated with the likes of Sean Lemass, T.K. Whitaker and Garret Fitzgerald. Southern advocacy for reunification has become dormant because of the peace process and financial crisis, though a more up-to-date articulation has been by Slugger O’Toole’s David McCann.

Arguing for a united Ireland on an economic basis makes sense for obvious reasons. Jobs and taxes dominate political debate. But it’s also a response to the long held Unionist economic arguments against Dublin rule. An argument has of course turned 180 degrees. Long gone is Henry Cooke’s boast during Ulster’s early industrialisation: “look at Belfast and be a Repeler if you can”. No longer is it that Ulster cannot afford to be a country with the backward south, but that Ulster would be too great a burden on the Republic.

gdp per capita ireland northern ireland

Sources: Maddison Project; Birnie & Hitchens; 1913 is all-Ireland and 2009 is GVA per capita

As can be seen in the graph above, Ireland’s GDP per capita (adjusted for purchasing power) surpassed Northern Ireland’s in the mid-1990s. Yet the fact that Unionist opposition, whether in public or in polls, did not alter significantly during the Celtic Tiger suggests that their opposition to Dublin rule is more inherent. As the economic facts changed, their arguments against a united Ireland seamlessly moved from the south being a basket-case to the North being a basket-case that the south could not afford. And while Unionists’ arguments for the Union has changed, their fundamental position has not. Nor are they alone in deeply held convictions. In the 1950s when Ireland was experiencing economic hardship and mass emigration to the UK, and the North was enjoying the benefits of the new welfare state, there was few calls by nationalists to consider re-joining the Union. There is more to life than economics.

A simple response to the naysayers and polling by those who would vote Yes in a border poll is that once a campaign is under way opinion will change. Because no plebiscite has been called there has been little debate and discussion about what a united Ireland would look like. Indeed, the last serious economic study on reunification was carried out by DKM Consultants for the New Ireland Forum in 1984. With the prospect of Brexit and Scottish independence, some nationalists and republicans hope that a break-up of the UK would lead to a serious reconsideration of the Union by the Protestant community.

This may be so. But needing a political crisis to achieve support means that you have failed to convince in more peaceful times. There are no guarantee that a state formed in such circumstances will prosper, economically and otherwise. And while it’s true that there has been little debate about the ins and outs of reunification, that is partly the fault of nationalists and republicans for not making arguments. Sinn Fein’s “debate” on it essentially started and ended when Alex Maskey could not answer the basic question of what would happen to the NHS in a united Ireland. For the time being unionists should be reassured by the BBC/RTE poll.

Posted in Uncategorized | Leave a comment

Population Pyramids of Ireland, 1841-2011.

Ireland Pyramids Gif 2019

Sources: W.E. Vaughan and A.J. Fitzpatrick, Irish Historical Statistics: Population 1821-1971 (1978) ; CSO ; and NISRA

If blurry, it is also posted on Twitter and Imgur.

The population numbers are for the island of Ireland. This is for continuity (and simplicity!), as pre-partition figures are on a 32 county basis. It is all census data.

Three things:

  1. The earlier 19th century figures should to be treated with some caution and viewed generally rather than specifically. There’s a clear bias for the first five year cohort (i.e. 10-14, 20-24, 30-34 …). I presume this is because some did not know their date of birth so chose (or were given) a rounded age in the tens (i.e. 10, 20, 30 …).
  2. Ireland’s population trend of decline in the century after the late 19th century is unique, and the island’s population remains someway off its pre-Famine peak.
  3. Notable that it is the children at the bottom of the 1971 and 1981 slides who were to first to fully make it up the pyramid. Before then the adult population is usually smaller than previous population of children suggests. Lower child mortality might partly explain, but emigration is surely the main reason.


Posted in Uncategorized | Leave a comment

Dublin Opinion (1922-1968)

Dublin Opinion was a satirical magazine published in Ireland from 1922 to 1968. Founded by Arthur Booth, Thomas Collins and Charles E. Kelly (CEK), it lampooned Irish society in the decades after independence. Both Collins and Kelly were also civil servants while publishing cartoons, though it’s not clear which was the avocation.

Charles Kelly, incidentally, is the father of the actor Frank Kelly, best known for playing Father Jack in Father Ted. The publication fell into financial difficulties in 1968 and ceased its monthly editions, though an annual was released for several years. An attempted 1987 revival, in part by Frank Kelly, was unsuccessful.

In the bitter years of the Civil War and thereafter, Dublin Opinion provided some much needed comic relief. Several cartoons are mooted as its most ‘famous’. One from the 1920s entitled ‘The night the Treaty was Signed’ depicted a hoard of Corkonians filling the road to Dublin in search of government jobs. Another before the closely defeated refrendum to remove proportional representation had De Valera writing on Broome Bridge “FF-PR=FF^n”. T.K. Whitaker has often cited Dublin Opinion’s view of decline and stagnation of the 1950s as an inspiration. But despite been closed for half a century, its humour can still be appreciated.

dublin opinion, if only

dublin opinion econ war 1dublin opinion econ war 2

dublin opinion census

Source: Cormac O Grada, ‘Five Crises’, T.K. Whitaker Lecture (2011): https://www.centralbank.ie/press-area/speeches/Pages/AddressbyProfessorCormacO’Gr%C3%A1da,oftheSchoolofEconomics,UCD,totheCentralBankWhitakerLecture,29June,2011.aspx dublin opinion irish times

A view of the Irish Times in the 1920s, from their ‘Grangegorman correspondent’

dublin opinion kildare

‘Ceilidhe in the Kildare Street Club’

dublin opinion commissiondublin opinion

Source: Cormac O Grada, ‘Rocky Road: The Irish Economy Since the 1920s’

the night the treaty was signed

“The Night the Treat was Signed” (1931)

Posted in Uncategorized | Leave a comment