
Sources:
- UK: ONS
- Northern Ireland: NISRA
- Scotland: National Records of Scotland (1951-1981) and (1981-2014)
- Republic of Ireland: CSO
- Not included in the graph, but StatWales has recent estimates for Wales.
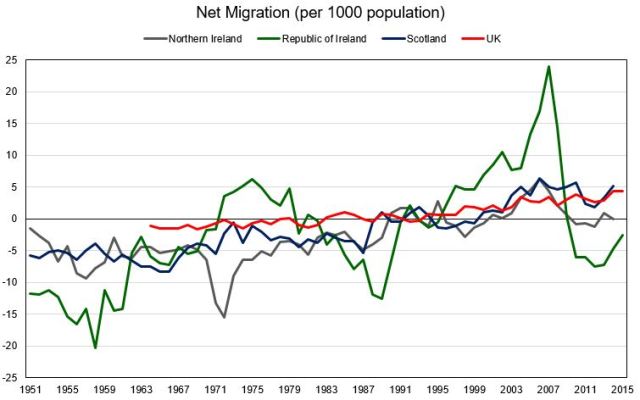
Economic and social statistics are usually best illustrated comparatively. A country really only knows itself when compared to its peers. And the flow of people in and out of a state is one important indicator. In recent years, immigration has been a major political issue in the UK. While emigration has been a focal point in Ireland for almost two centuries.
Unfortunately long-term statistics on migration are not always available. Because of a lack of standardized methodology in calculating migration, there is reason to be skeptical about the estimates cited above, including recent data. The techniques used by the British ONS have been labelled untrustworthy – sometimes by the ONS themselves. The Irish CSO’s methodology is a bit broader, but the last two Irish censuses have shown its annual migration estimates to be faulty. Nonetheless, the graph will hopefully give an accurate picture of the trends and scale of net migration, even if the exact numbers are suspect.
Net migration was negative in Ireland and the UK for most of the 1950s to the early 1980s. From the 1990s net migration turned decisively positive in all countries, except the two Irelands after the financial crisis. The most volatile migration is clearly the Republic of Ireland. Overall emigration there has been the largest, but so too was immigration in the 2000s. The only other spike was Northern Ireland during the onset of the The Troubles in the late 1960s and early 1970s. The variation on Scotland and the UK has been much less.
Ireland may have another surge in immigration if its economy improves. And Brexit limits access to the UK, a major immigrant destination. Although, unfavorable electoral results across the Irish Sea and Atlantic may result in a downturn and further emigration. History suggests the swings will continue to be large.
