
Source: Census of Ireland 1841-2016.
Note: Tourists and visitors were included from 1841-1936 and 1971. British military included 1841-1911. Rest are “Usually Resident” or “De Jure” Population.
Ireland was long a place many wanted to leave. Only recently has it been a place many wanted to come to.
The immigration that accompanied the Celtic Tiger was the largest since the 17th century. While there were immigrations in-between – of Huguenots, Palatines, Lithuanian Jews, and others – they numbered in the hundreds or few thousands. Today’s immigrant populations are in the tens or hundreds of thousands.
“Foreign-Born Population” is the most commonly used measure of immigration’s scale. As the name suggests only place-of-birth is counted. Ethnicity, nationality, length of residency, and so forth, are separate measures and do not count.
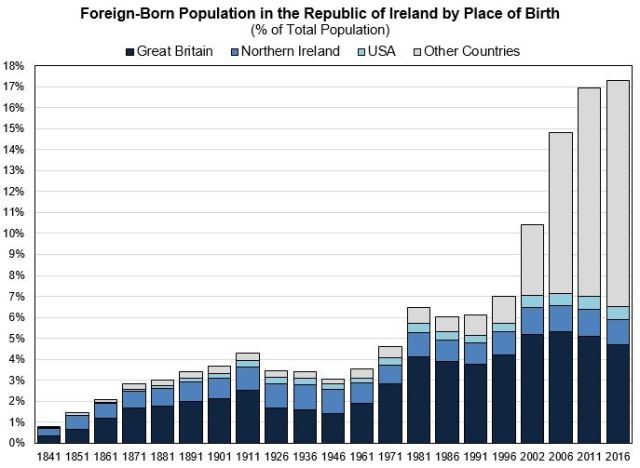
Irish birthplace statistics are available since Census 1841. As they were tabulated by county before independence, it’s possible to calculate on a 26-county basis. (For consistency and simplicity only Republic of Ireland is included in this post). One problem with the time series is that until recently only a handful of countries were included in Census reports. As such, it’s only possible to include three places and an “Other Countries” remainder in the chart.
Its most notable feature is clearly the remarkable increase from the 1990s. In Census 2016 there were 810,400 people (17.3% of the population) who were born abroad and usually resident in Ireland. The share has more than doubled in last 20 years and risen five-fold in last 50 years. This is all the more striking given the native-born population (the main part of the denominator) has grown strongly as well.
First, however, it’s worth noting some possible limitations. As illustrated, a few percent of Ireland’s population has always been born abroad. Indeed from 1981-1991 the rate was 6%, which was actually around the West European average. That’s despite the fact that the 26-counties was considered to be a relatively ‘homogeneous’ until the 1990s, having missed out on both Europe’s post-war economic and migration booms.
There are a few reason why it may overstate what many would consider to be “immigration”:
- Those born in Northern Ireland are counted as foreign-born. In the past 160 years, 6-county born have made up about 1% of 26-counties’ population. In Census 2016 there were 57,300 (1.2% population). There’s a good argument to subtract them, making the Republic of Ireland’s “Foreign-born Population (excluding Northern Ireland)” 16.1% in 2016.
- Returning members of Irish diaspora are counted as well. The Republic has one of the highest “Native-Born Populations Living Abroad” rates in the OECD. In the past it was even greater. The bulk of emigrants went to English-speaking countries (UK, North America, and Oceania) and until Census 2006 that’s where most foreign-born originated. While it’s difficult to be precise as there’s no statistics on parents’ place-of-birth, many were and are the children or grandchildren of Irish emigrants. It was particularly obvious during 1970s – the first period of positive net migration for centuries. Between Censuses 1971-81 the 0-19 year old UK-born population increased by 50,000 and USA-born by 5,000. Nearly one-in-ten of that age-group was foreign-born in 1981. Another imperfect measure (see further below) is ethnicity: 28% of foreign-born people said they were “White Irish” in 2016.
- Ireland’s close links with Britain arguably means migration across the Irish Sea should be considered regional rather than international. There have been freedom of movement agreements between the two countries since 1923. Unsurprisingly, Great Britain has historically been the main non-Irish place-of-birth. It has fluctuated over time. From 1911-26 there was a sizeable fall, mainly because of withdrawal of British administration and army. But from 1961-81 and in the 1990/2000s there were notable increases, thanks mainly to economic growth, which made Ireland a more attractive place for emigrants to return and British people to come. Although its share of total foreign-born has fallen, Great Britain remains the single largest birthplace.
A crude calculation could subtract those born in Northern Ireland (1.2% population in 2016), Great Britain (4.7%), North America (0.8%) and Oceania (0.2%) from total foreign-born (17.3%) leading to an alternative share of 10.4%. This of course quickly runs into trouble – why include some groups and not others? But it could perhaps be said that around 4-in-10 of Republic of Ireland’s foreign-born population are the old sort of “immigrants”. Many of whom would be in Ireland regardless of economic booms or migration policies. And it’s certainly worth pointing out that Ireland had an existing foreign-born stock before the Celtic Tiger. It didn’t suddenly jump from zero to 17.3%.
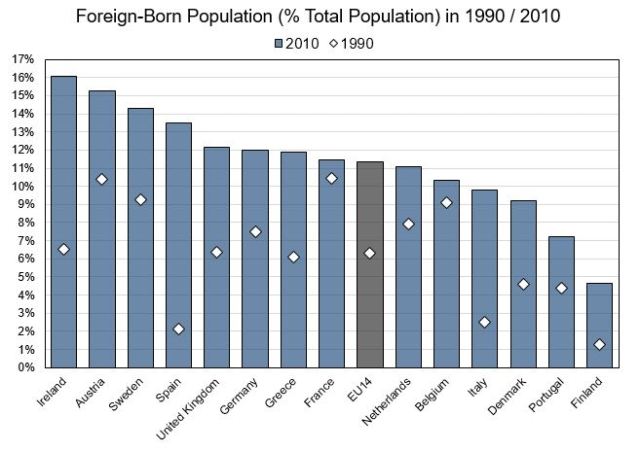
Source: United Nations International Migration Stock Database (2017 edition)
It may be surprising that in 1990 the share was at the West European average. (Luxembourg is excluded as its rate is nearly 50%). The share is now has one of the highest immigrant rates in the EU and OECD, although because of the financial crash (which impacted Ireland more) and migration crisis (which so far has impacted less), several European appear to have jumped ahead in rank. Of course all points above about border changes, immigration from diaspora, and from neighbours apply to many countries. For instance, the main foreign birthplace in Austria is Germany. Nordic countries all have populations born in each other’s countries.

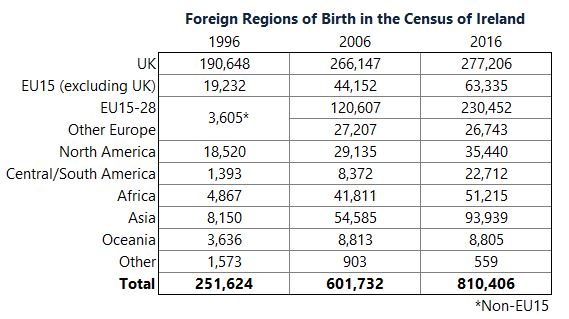
The table above shows that Ireland has always been home to people from abroad. (The years chosen are simply those that were available). A couple thousand continental Europeans have appeared in every post-independence Census. The British Empire is also evident and not only the majority settled colonies. Tens of thousands of Irish emigrated to British India (now Bangladesh, India, Myanmar, Pakistan and some Gulf States) and South Africa. So some of the nearly 2,000 Indian born in 1926 would be children of Irish parent(s). For comparison, the Census for England & Wales in 1931 counted 86,000 who were born in British India, but an estimate in the Indian Census of that year estimated only 7,200 of them were of South Asian descent. This still means that there were people of other and mixed heritages in both UK and Ireland for many decades and centuries.
Russia was perhaps a surprising inclusion in 1926. As with all explanations here it wouldn’t include everyone, but many were the Jewish immigrants at turn of 20th century, from what are now Baltic States, then part of the Russian Empire.
Census 1961, which unfortunately was the last for a while to provide detailed birthplaces, listed 5,429 born in Continental Europe, 1,628 in Africa, 2,124 from Asia (also 57 from Japan) and 612 from Central/South America. While it’s important to note past diversity, it doesn’t change the fact that Ireland has been partially transformed in recent years. Census 2016 listed 320,530 from Europe, 51,215 from Africa, 93,939 from Asia and 22,712 from the Americas.
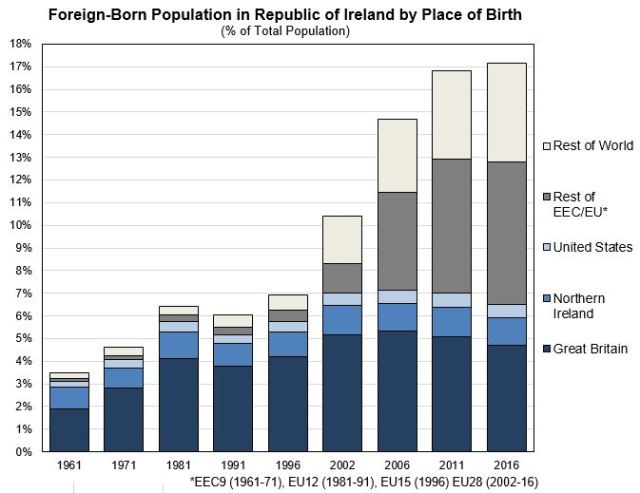
The chart above is the same as first chart, but with “Other Countries” split between “Rest of EU” and “Rest of World”. Past Censuses only included a select group of European countries until 2000s, typically the EEC/EU member states at the time. Long-term time-series for EU15 and EU28 are unfortunately unavailable. Approximation should be reasonable given European-born population was relatively small until the 1990s and numbers from most countries left out (especially former Eastern Bloc states) would have been very small.
When Ireland joined the EEC in 1973 it was suggested the Irish migration might shift from Britain and its former colonies to the Continent. This has yet to happen significantly with emigration, which remains stuck to the old destinations. But did eventually happen with immigration, though not with original member states.
The “EEC9 (excluding Ireland & UK)”-born population did rise post-accession in 1973, from 4,950 in Census 1971 to 9,500 in 1981. But then fell slightly in 1986. These modest numbers are unsurprising as Ireland was the poorest member at the time. It was less modest in the 1990s. The rest of EU15-born population rose from 13,000 in 1991, to 32,000 in 2002 and 63,300 in 2016. (For previous comparison, the EEC9 population was 24,100 in 2002 and 43,200 in 2016).
New EU members accounted for most of the EU influx. 40% of foreign-born increase of the past 25 years was from EU15-28 countries. The accession of 11 countries in 2004 coincided with Irish property bubble’s height. In addition to demand for labour, only Ireland, Sweden and the UK had no initial restrictions on freedom of movement. Their population rose from 16,390 in 2002 to 293,797 in 2016. Nearly all came from former communist countries in Eastern Europe. Poland and the Baltic countries being the main sources. As Census 2006 was carried out in April, it missed out on most of 2006 and 2007 when immigration was peaking. It’s likely that the Eastern European population pre- 2008 was even greater than reported in following Censuses. The immigration surge was followed by sharp emigration. More EU15-28 nationals emigrated than Irish nationals until 2011. Between Census 2011-16 there were small falls for several countries, but the group’s overall population rose, thanks to newer new member states, Bulgaria, Croatia and Romania.
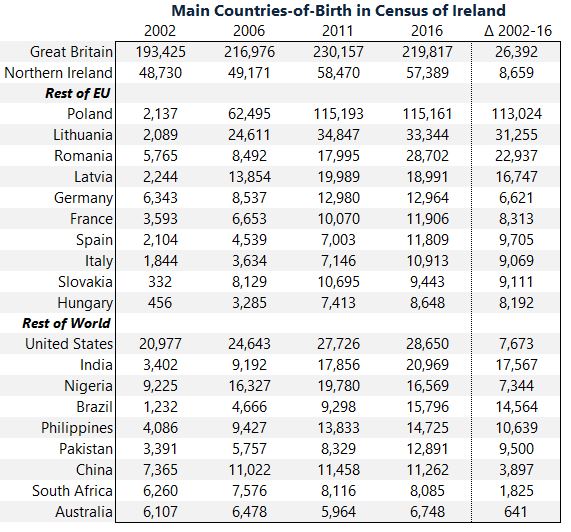
EU countries have accounted for about two-thirds of foreign-born increase since 1996 (this falls to half if the UK leaves). The Rest of World was mainly made up of countries that had small or non-existent communities before. While more traditional sources in North America and Oceania doubled in population, the bulk of increases were elsewhere.
Non-EU migrants usually come to Ireland after gaining residency permits for education, family or work reasons. The prospect of a well-paid job (by global and regional standards) would be the single biggest reason people are attracted to Ireland. Most foreign nationals are in employment and they have a higher labour force participation rate than Irish nationals. Foreign students in university and English language schools have grown as well, although many would have returned out of choice or because residency permit expired. A smaller number are asylum seekers. From 1989-2018 there have been 95,000 individual asylum applications. Not all would appear in the Census as some would have left the country or passed away.
The main countries of birth are perhaps those you would expect – i.e. places with large populations and poorer than OECD average. The composition of Ireland’s immigrant population is somewhat similar to the United Kingdom’s. (Note: UK’s population is 13 times that of the Republic’s). Broadly speaking the UK as relatively more Commonwealth immigrants and Ireland has more Eastern Europeans.
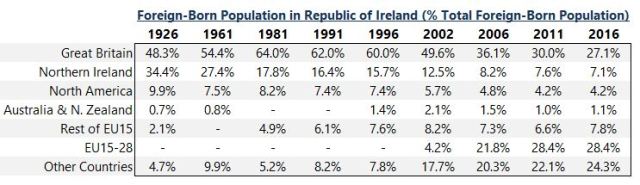
The table above shows how foreign-born population has changed by broad region. A few entries are empty and Censuses skipped because data was unavailable. The “Other Countries” here is a residual rather than consistent category. As it shows until the 2000s the bulk of “immigrants” in Ireland were from the English-speaking world. As these were the countries where Irish emigrated to, a sizeable proportion were probably their children. Recent experience is obviously different, with a shift away (in percentage terms) from the old and towards the new. There has been a modest increase in EU15 population share, but most of the increase has been elsewhere. Having probably been around 10% in the early 1990s, the EU15-28 and Rest of World now account for over half of foreign-born population.
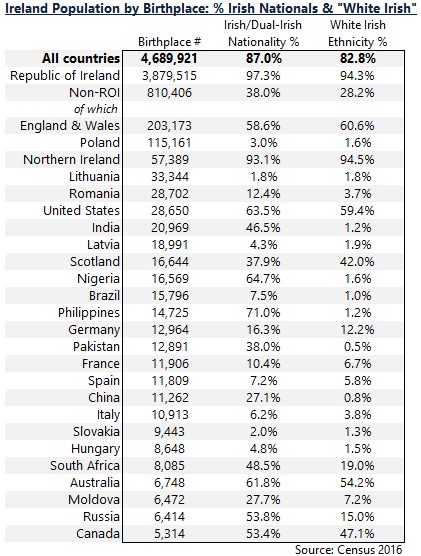
Since 2006 there have been questions about ethnicity and nationality on Census forms. The table above shows Ireland’s population by birthplace and percentage who were Irish nationals and of “White Irish” or “White Irish Traveller” ethnicity.
The “Non-National-Population” is often used synonymously with foreign-born to measure immigration, which can cause confusion as they are different. In 2016 the Non-Irish national population was 13% of population compared with the foreign-born 17.3%. From 2011-16 the non-national total fell, because there was an increase in granted citizenships after 2011 reforms. Since 1998 over 150,000 citizenships have been acquired. 38% of foreign-born people have been naturalized.
Even if nationality is no longer a good estimate of “immigration” it’s still perhaps a truer measure of the “Non-Irish” population. A caveat is that there’s a clear difference between those born in the EU and outside it, with the latter much more likely to have become naturalised. This reflects the fact that it’s harder to live and live securely in Ireland if you were born outside the Single Market.
Ethnicity is used as measure of immigrant integration. It’s a controversial and debated concept. And as a statistic it can be problematic too. In Census 2016 there were 125,000 who did not fill out the question or did so improperly, which was higher than other question non-responses. As such, the “White Irish” percent (82.8%) may be a bit higher. Another issue is that mixed ethnicities were not tabulated fully.
The “White Irish” and “White Irish Traveller” percentages does re-emphasize the fact that foreign-born include children of Ireland’s mass emigration. People who Irish-born parents or grandparents are entitled to Irish passport. They’re particularly high for English-speaking countries. Though too small to be included in the table, the share is also high for other Commonwealth or entrepôts (Gulf States, Hong Kong, Kenya, Singapore, Zambia and Zimbabwe). Again a reasonable guess is that these are the children of returning Irish emigrants. 28% of foreign-born are of “White Irish” ethnicity. It might be closer to a third if you included those with mixed/Irish ethnicity and dealt with non-responders.
Immigration from diaspora could fall if the Irish emigrant stock continues to decline. The emigration after the 2008 financial crisis was in fact smaller than the 1980s and much smaller than 1950s. On the other hand, assuming Ireland remains an open and prosperous country it will continue to attract migrants. As such, the caveats about foreign-born statistics may no longer apply in the future. But for now it’s something to bear in mind.
