
Sources: Commission on Emigration; Reports of the Register-General; CSO; NISRA
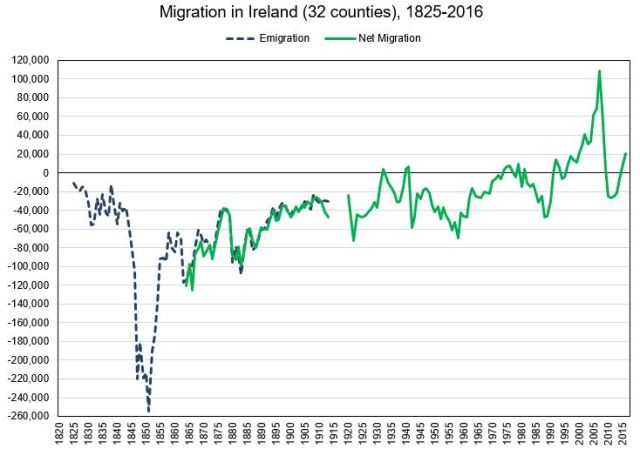
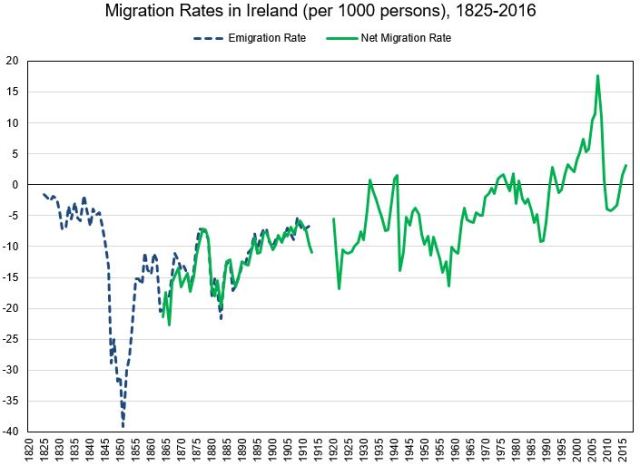
The graphs above use two sources. First, the emigration statistics are from the Commission on Emigration (for 1825-1850) and Irish Register-General (for 1851-1913) [1]. Emigration (or “gross emigration”) is expressed as a negative number here. Secondly, net migration (immigration – emigration) is the annual residual from population change less natural increase (births – deaths). It starts in 1864 – the year Irish vital statistics are first available [2]. For consistency after partition, 32 county data is used throughout. In other words, after 1922 the annual net migrations of Northern Ireland and the Republic of Ireland are added together.
The graphs’ sources certainly have their problems. Nineteenth century emigration statistics are usually considered to be underestimates. If more accurate totals existed the emigration line would definitely be pushed down a bit in most years (i.e. emigration would be higher). And the same may be true of net migration because of the underreporting of births in the 19th and early 20th centuries. But the broad picture would probably look similar.
Nonetheless, migration graphs are perhaps the single best illustration of Irish history the last 200 years. Even if understated, the emigration line clearly shows the exodus during and following the Great Famine. There were additional emigration spikes in the 1860s and early 1880s – the latter partly explained by the 1879 mini-famine and agricultural depression.
While tens of millions migrated from Europe to colonies and ex-colonies abroad, the outflow of people from Ireland was extraordinary. From 1850 to 1913 the Irish emigration rate was more than twice that of any other European country. This multiple would be greater if the period from the end of the Napoleonic Wars to the start of World War I was counted. Overall about 8-9 million left Ireland in the century before independence and partition.
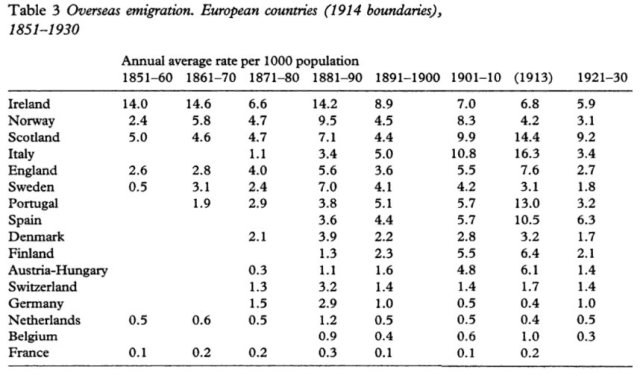
Source: Dudley Baines, “Emigration from Europe, 1815-1930”, page 4
The emigrant flood did subside somewhat as the 19th century was drawing to an end. By the 1900s Norway, Italy and Scotland had higher rates. There was also more emigration in parts of Central and Eastern Europe, such as Galicia and Poland. Several reasons have been proposed for Ireland’s slowing emigration – economic and political rights for Catholics, land reforms, industrialization of north-east. Economic historians have pointed to rising living standards of the time. Hatton and Williamson explained it narrowing wages between Ireland and other English speaking countries. Another factor may have been that many who wanted to leave or were potential emigrants had already left. The exodus from 1840s was still within living memory. Yet of course the falling rates were from extreme levels, and as the chart shows, Irish emigration was still among the highest in Europe.
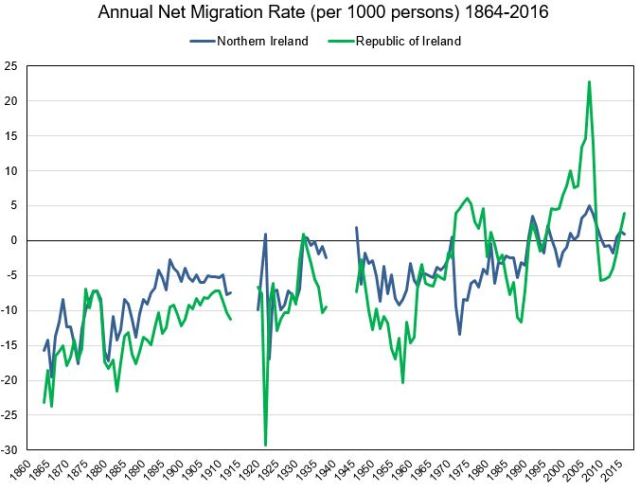
Sources: Reports of the Register-General; CSO; NISRA
Comparisons between what became Northern Ireland and the Republic before partition are possible thanks to Irish vital statistics being reported on a county/district level from 1864 [3]. All of which is made easier by the fact that Saorstat statisticians included long-term 26 county data in their early reports. Because of net migration volatility the World War years are excluded. There’s a notable spike just after partition in 1922/23, partly because of movements of army personnel. For 26 counties this would include emigration of Protestants and people connected to the UK administration in Ireland (e.g. civil servants, police, and their families).
Before partition, net migration was usually lower (i.e. emigration higher) in the 26 counties than in the 6 counties. Indeed this was the case until the early 1970s, when the outbreak of The Troubles resulted in sustained Northern emigration. Migration has generally been more variable in the 26 counties since the Famine. Independence did not stop people leaving, as evident during the downturns of the 1950s, 1980s and 2010s. But there have also been large inflows during the 1970s (mainly returning Irish emigrants) and 1990/2000s (mainly non-Irish immigrants). The latter was the first substantial immigration into Ireland since the plantations of the 17/18th centuries and exceed immigration rates seen in other EU countries (e.g. UK and southern Europe).
For most of the 19th and 20th century Ireland was a place many wanted to leave. It’s only recently that it has become a place many want to come to.
[1] Emigration:
- 1825 to 1851 is from the Commission on Emigration report in Table 26, pages 309-11.
The Commission on Emigration was set up by the Irish government in 1948 and published its findings in 1954. The report reproduced several long-term demographic tables. The sources given for this data was:
1 1825 to 1832 and 1835 – Reports of the Register of Shipping
2 1837 – Report of the Agent-General for emigration from the United Kingdom.
3 1833, 1834, 1836 and 1838 to 1840 – Reports of the Census Commissioners, Ireland, 1841.
4 1841 to 1871 – Report of the Colonial Land and Emigration Commissioners
The statistics for points 1, 2 and 3 represent all emigrants from Irish ports plus two-thirds who went from Liverpool for overseas destinations.
19th century emigration statistics are considered to understate the actual amount. For instance, emigration to Britain is either not counted or substantially under-counted. But as far as I am aware this is the only pre-1850s time-series of Irish emigration.
Until partition there are estimates made by the UK Emigration Commissioners (not to be confused with Irish Commission on Emigration!) of people departing British ports for non-European destinations. However, they exclude Irish emigration to Great Britain, so after 1851 Irish emigration estimates are used instead.
- 1851-1913 is the Register-General estimates of Irish emigration from Irish ports. They were included in the annual Register-General reports, and were reproduced in the Commission on Emigration (Table 28), Vaughan and Fitzpatrick, and Ferenczi and Willcox (page 730-31). The latter is available online.
The Register-General included breakdown by county of origin from 1851 (though this is rather volatile) and by destination from 1876. Unfortunately it’s likely that these estimates are “a considerable underestimate”, especially for emigration to Great Britain. Ó Grada has suggested that total emigration was close to 5 million, about 1 million more than the Register-General’s total. With more accurate data, the emigration lines in the chart would be pushed down a bit each year.
[2] Net Migration: This is from the residual (or indirect) method, where
Population (n) = Population (n-1) + Births – Deaths + Net Migration
therefore
Net Migration = Population (n) – Population (n-1) – Births + Deaths
The data come from the Irish Register-General reports from 1864, the year vital statistics are first available. The populations are mid-year estimates, and the births and deaths are annual. A more thorough series would use mid-year births and deaths (i.e. Q2 year n-1 to Q2 year n). Quarterly data is in every Register-General report since 1864, thought it would take some time to gather. In any case the graphs would look identical. The same method and net migration residuals before partition can be found in Franz Rotenbacher’s “The European Population, 1850-1945”.
The residual method is not ideal for several reasons. It does not measure the difference between emigration and immigration. While immigration and return migration was fairly small in the 19th century, both have become important since the 20th century. A more serious problem is that the residual depends on other components being accurate, which is not the case.
There is reason to believe that the net migration was in fact lower (because emigration was higher) in the 19th and early 20th centuries. Both births and deaths were under-registered, with births probably more so than deaths. This would imply that natural increase was higher than stated, and assuming the mid-year population was correct, net migration by definition be lower or more negative. The late Brendan Walsh summarized criticisms of Irish vital statistics in this article.
After partition the net migration residuals of Northern Ireland (from NISRA) and Republic of Ireland (CSO) are added together. The same caveats above apply, though vital statistics’ errors have been reduced.
[3] North-South Net Migration: The early Free State/Saorstat Register-General reports included long-term population and vital statistics tables for 26 counties. The early Northern Irish reports were not as statistically generous, so from 1864-1900 the Northern net migrations are from 32 county minus 26 county population changes, births and deaths.
The sources north and south are:
- Northern Ireland: Annual Reports of the Register-General for Northern Ireland:
- https://www.nisra.gov.uk/statistics/registrar-general-annual-report/registrar-general-historical-reports
- NISRA also have time-series data for population, births and deaths.
- Republic of Ireland: Annual Reports of the Register-General (and Vital Statistics after 1953): http://www.cso.ie/en/statistics/birthsdeathsandmarriages/archive/annualreportsonmarriagesbirthsanddeathsinirelandfrom1864to2000/
- The early Register-General reports have 26 county vital statistics data since 1864. For example pages of the 1928 Saorstat Eireann Register-General report. Until recent years, all reports contained a population since 1800 table.
- CSO Databank have complete annual birth data since 1864 and deaths since 1989.
