

Preliminary results for Census 2016 were released on 14th July by the Central Statistics Office of Ireland (CSO). The initial results include estimates for country and county population, net migration, and housing. More detailed stats will be available from March/April 2017.
In the next 5 years the Census will often be used by policymakers to determine where resources should be allocated. And ideally the data will help inform debates on issues such as housing, migration and religion.
But as well as the practical uses, new Irish censuses provide an update on Ireland’s unusual demographic time-series. The Republic of Ireland is the only developed state whose population now is lower than its mid-19th century level. Mary Daly has suggested that Ireland is the only country whose Census results draw immediate comparison with the 19th century. The press certainly obliged, with The Irish Times headlining with “Population at highest in over 150 years despite high migration”.
Past censuses had political importance too. Irish public figures were well aware that Ireland’s population decline was at odds with most of the UK and Europe. Before independence blame was attributed to misrule from London. So it was somewhat embarrassing that rule from Dublin did not stop the decline. To add insult to injury, the population of the 6 countries that became Northern Ireland saw its population rise again in the 1890s. In the 26 counties there was a minor population increase in 1951 Census, but it was not until 1966 that there was a sustained increase.
The magazine Dublin Opinion had a number of demographically themed cartoons in the 1950s when emigration was soaring. The above example, “Term Report”, depicts the Taoiseach Sean Lemass as a schoolboy entering a classroom. At the door is a teacher (representing Ireland) with a copy of “The Census” in her hand. For much of the 19th and 20th centuries the country failed its tests.
With the importance of the Census hopefully established, below is some brief analysis and graphs looking at the past and present of Irish population. (The future will be available when the CSO update their projections, probably in 2018).
- Ireland’s Population Change, 1821-2016


Sources: CSO, NISRA, W.E. Vaughan & A.J. Fitzpatrick, Irish Historical Statistics: Population 1821-1971. Wikipedia has some of the figures.
4,757,976 people were enumerated on Census Night, Sunday 24th April 2016. Representing an increase of 169,724 people since Census 2011. The growth rate of 3.7% is marginally below the post-Independence growth rate of 3.9%.
To allow for comparison and for pre-1922 consistency, Northern Ireland is included in the above graph and chart. Because Irish Census is every 5 years and the UK Census every 10 years, the figure in-between are NISRA’s estimates. The most recent Northern Irish total for 2015 of 1,851,600.
Consequently, the island of Ireland’s population in 2015-16 can be estimated at 6,609,576. This is the highest level since the 1851 Census and probably the late 1840s when the population was collapsing. But still well short of the approximately 8.5 million in 1845. NISRA and UN projections (that require a large grain of salt) suggest reaching the pre-Famine peak may be possible towards the end of the century.
- Components of Ireland’s Population Change
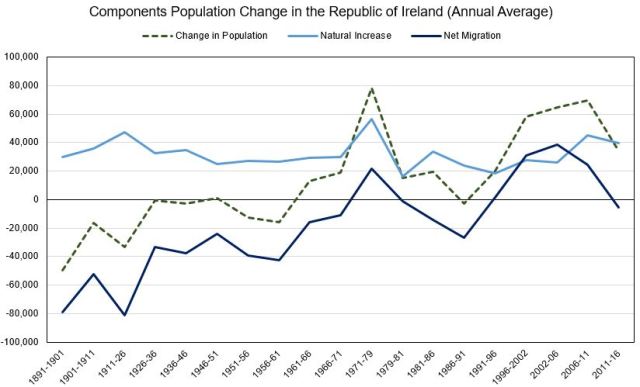
Sources: Census 1971 (1891-1926) page 1, CSO (1956-2011), CSO (2016) Note: Net Migration above zero means immigration exceeds emigration. And vice-versa for below zero.

The Census revealed almost 100,000 more people living in the Republic of Ireland than previously estimated. The CSO’s annual population estimate in August 2016 had total population at 4,670,000. All six of their projections made in 2013 fell short of the actual figure.
The main reason is that net migration (immigration less emigration) was not as negative as thought. There was still a sharp fall in net migration of -28,558 (-5,700 annually), turning negative for the first time since 1986-1991. But this was higher than the -100,000 or so that was predicted. Population change consists of natural change (births less deaths) and net migration. Because annual stats on births and deaths are considered trustworthy, the Census’ net migration figure is a residual (population change less natural change).
At fault was the CSO’s annual estimates, which are based on analysis of the Quarterly National Household Survey, visas issued, and PPS and UK National Insurance numbers. A sample can give a good picture of a population’s characteristics, but estimating its size is trickier. Ireland is not alone in having trouble measuring migration: similar problems have occurred in the UK.
It will be interesting to see whether net migration was higher because of fewer emigrants or more immigrants. Or a bit of both. Since the financial crisis there has been an abundance of anecdotal evidence about emigration. Leaving the explanation to non-Irish immigration, perhaps driven by non-EU nationals. The answers will be provided in the Spring’s detailed reports.
Net Migration varied widely by county. Cork, Dublin, Laois, Longford and Kilkenny were the only counties to see positive net migration. (County measures include migration within Ireland, e.g. from rural parts to Dublin). Within counties there was a clearly more inflows into urban areas. Cork City had a net inflow of 4,380, while Cork County had outflow of -2861. More urban counties (Carlow, Louth, Meath, Wicklow) had negative net migration only in the hundreds. Dublin had the largest inflow of 7,981, although Dublin South was the only local authority region with negative net migration of -4,217. Donegal, which often performs badly on economic and social metrics, had the largest outflow at -6731.
As the first graph shows, change in population has historically been largely determined by swings in net migration. Natural change has varied, but not in the same degree as migration.
The second graph shows the composition of natural change. The birth-rate has exhibited variation. There was a baby-boom in the 1970s and this cohort (along with immigrants of similar age) is responsible that hike in births in the late 2000s. Though declining during 2011-2016, the birth rate started off in an elevated positions. So it was expected that Ireland’s population would increase, regardless of emigration. Along with the rest of the Western world, birth rates will probably fall in Ireland, resulting in a smaller baby boom forecast in the 2030s. The number of deaths in Ireland has fallen a bit over the years thank to medical and public health improvements. A stat that looks even better when the increased population is considered and is measured as the death rate per 1000 persons.
- County Population and Rural Ireland
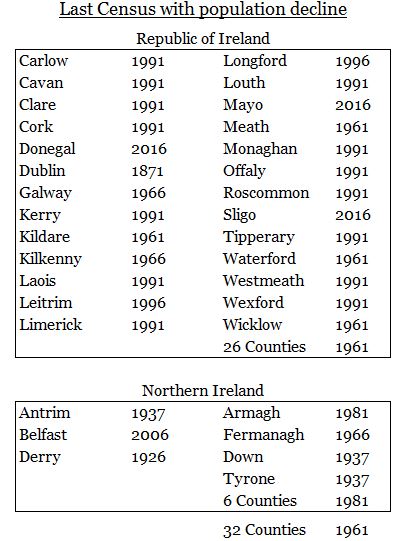
2011-2016 was the first period since 1991-1996 where there was population decline on a county level. This occurred in 3 counties: Donegal (-1.5%), Mayo (-0.2%) and Sligo (-0.1%). The above chart shows the last Census year counties suffered falling numbers of people. There is a clear urban bias, with more rural counties suffering declines more recently. Dublin is the notable outlier having last seen a fall in 1871. It was the 1960s for most of the counties bordering the capital.
For comparison Northern Ireland is included again. (Since the 19th century Irish and then Northern Irish censuses counted Belfast city as a distinct entity. So the Co. Antrim and Down population totals exclude the city). Population in the 6 counties recovered much faster than the rest of the country, in large part because the north-east was the only part of the island to industrialize. But subsequent de-industrialization and the Troubles have caused more recent falls.
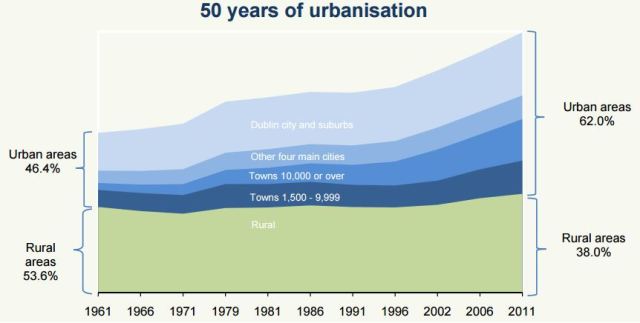
Source: CSO, This is Ireland: Part 1 (2012), page 13
Irish population decline has always been associated with rural depopulation. Although Ireland remains one of the most rural countries in the OECD, the bulk of modern population increase has been urban. As the above chart shows, rural population has been stagnant in the last 50 years, though if small towns are defined as ‘rural’ there has been a modest increase. According to the CSO’s definition of urban (an area with +1,500 people), Ireland officially became more urban than rural in the 1960s.
The flight from the countryside to cities has occurred in every developed and most developing countries. In a sense Ireland is still catching up with its peers, many of whom industrialized and urbanized over a century ago. Indeed the unusual part of Ireland’s demographic history is not that Irish people migrated from rural to urban areas, but that they went to foreign cities instead of Irish ones. Although statistics are not readily available, one would suspect that since the financial crisis most rural Irish emigrants have not gone to other urban areas in Australia, Canada and the UK.
Given Ireland retains a large rural population, increased urbanization is difficult politically. The plight of rural Ireland was a prominent issue during the 2016 General election. All parties are now promising to devote more resources to rural parts and it’s likely that future Budgets will be favourable. This is not surprising: with the exception of 44 Dublin TDs (and perhaps a few of the Cork City based TDs), the rest of the 114 members of Dail Eireann have significant rural areas in their constituencies. And it is not unreasonable for these rural constituents to lobby for funds.
Public debate has tended to conclude that there has been little or no recovery in rural Ireland, i.e. outside the M50 or past the Red-Cow roundabout. It’s an alleged fact that has been cited as a reason for Fine Gael’s poor election. Such claims have been challenged by the economists Dan O’Brien (mostly focusing on a county level) and Stephen Kinsella (on Eurostat-Irish regions), who point to the economic statistics showing a fairly widespread recovery. For instance, the agriculture sector is the only sector to have recovered to its pre-crisis employment peak. (Michael Taft has noted, however, that private sector employment growth outside Dublin has been slow). An exception is the West of Ireland. Here employment growth has not been strong, and as mentioned three north-western counties suffered emigration driven population falls. The “whingers” Enda Kenny met in Mayo probably had a point. So while claims about no recovery outside Dublin are false, there’s probably some truth in a “two-speed recovery”.
A final point concerns the definition of “rural”. The CSO defines rural areas as “all areas outside clusters of 1,500 or more inhabitants”. In 2011 that resulted in a rural population of 1,741,370 (38% of total). Using the OECD definition of 150 persons per Km2, Mary Gilmartin and David Meredith find a similar number of 1,890,000 (41%). A more expansive concept can be found in the terms of reference for the Commission for the Economic Development of Rural Areas, which defined rural Ireland as all areas outside the boundaries of the 5 largest cities (Cork, Dublin, Galway, Limerick and Waterford). Meaning rural Ireland accounts for about two-thirds of the country’s population. In truth, it often feels like it is everywhere except Dublin.
Despite different definitions, it’s actually on a micro-level that will probably show rural decline most clearly. In the Examiner, Eamonn Pitts did some Census analysis on electoral divisions, showing that more rural areas contrasted poorly with urban ones. Something that may be confirmed in the All-Ireland Research Observatory’s spatial map. As such focusing on a county or regional level may hide rural-urban divides within boundaries.
Ultimately the evidence suggests that some “rural” parts are doing poorly and some okay. Even within county borders. However, as indicated by the expansive CEDRA terms of reference, politicians (and many people) consider rural Ireland to include most of the country. And in turn believe that their constituents deserve more resources. Yet rural advocates run the risk of expanding their constituencies too widely. They may find that on an aggregate level their “rural” area is statistically doing alright. The current or next government will likely set up yet another CEDRA-like commission. It will have newer data at its disposal next year.
